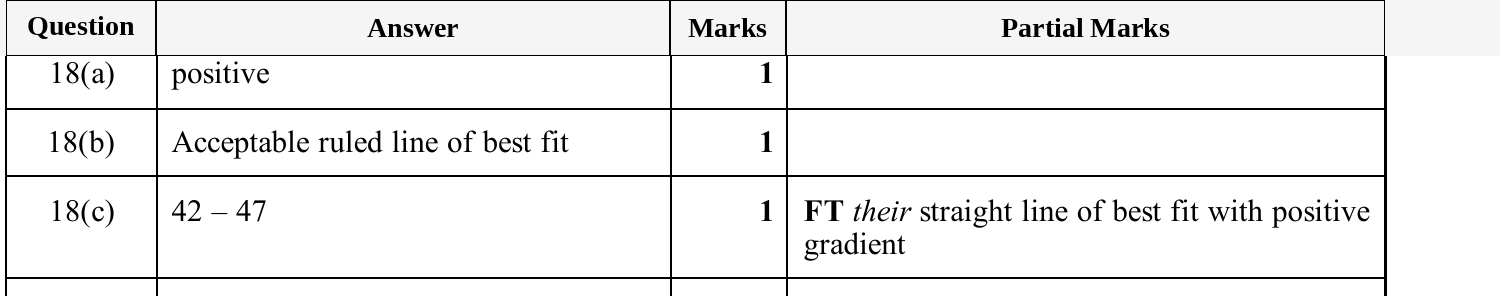
Question 18 — IGCSE 0580 Oct/Nov 2025 Paper 32
Cambridge IGCSE Mathematics 0580, Core tier, calculator. Topic: Statistics · Scatter diagrams. Worth 3 marks.
Open in interactive question bank →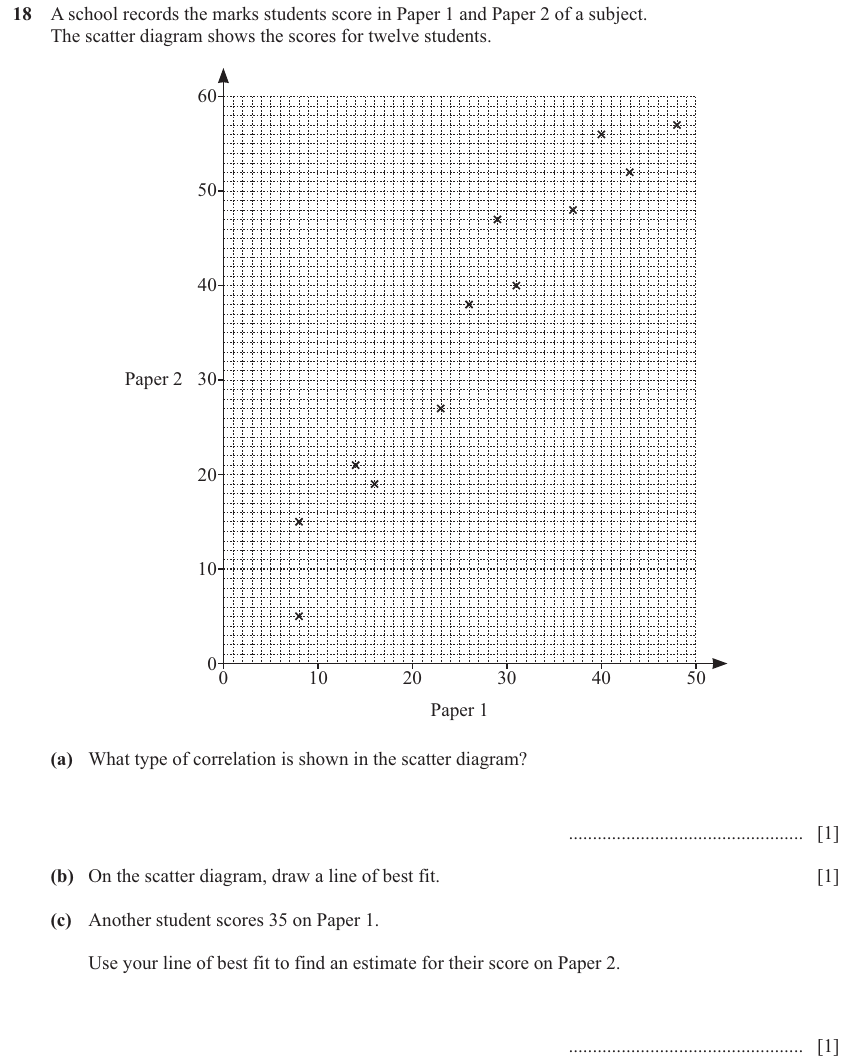
Question text
18 A school records the marks students score in Paper 1 and Paper 2 of a subject.
The scatter diagram shows the scores for twelve students.
60
50
40
Paper 2 30
20
10
0
0 10 20 30 40 50
Paper 1
(a) What type of correlation is shown in the scatter diagram?
................................................. [1]
(b) On the scatter diagram, draw a line of best fit. [1]
(c) Another student scores 35 on Paper 1.
Use your line of best fit to find an estimate for their score on Paper 2.
................................................. [1]
(cid:300)(cid:209)(cid:266)(cid:174)(cid:288)(cid:180)(cid:237)(cid:200)(cid:245)(cid:207)(cid:298)(cid:197)(cid:266)(cid:223)(cid:249)(cid:184)(cid:254)(cid:215)
© UCLES 2025 (cid:300)(cid:295)(cid:175)(cid:242)(cid:216)(cid:297)(cid:276)(cid:278)(cid:226)(cid:243)(cid:247)(cid:231)(cid:263)(cid:262)(cid:252)(cid:178)(cid:241)(cid:258) 0580/32/O/N/25
(cid:293)(cid:293)(cid:261)(cid:213)(cid:181)(cid:213)(cid:229)(cid:245)(cid:181)(cid:277)(cid:181)(cid:261)(cid:261)(cid:213)(cid:229)(cid:181)(cid:229)(cid:213)
M
SIHT
NI
ETIRW
TON
OD
NIGRAM
SIHT
NI
ETIRW
TON
OD
NIGRAM
SIHT
NI
ETIRW
TON
OD
NIGRAM
SIHT
NI
ETIRW
TON
OD
NIGRAM
SIHT
NI
ETIRW
TON
OD
* 0000800000011 *
11
(cid:44)(cid:1)(cid:1)(cid:1)(cid:1)(cid:9)(cid:1)(cid:1)(cid:1)(cid:1)(cid:1)(cid:1)(cid:2)(cid:2)(cid:44)
NIGRAM
DFD
Mark scheme