Question 4 — IGCSE 0580 May/June 2023 Paper 32
Cambridge IGCSE Mathematics 0580, Core tier, calculator. Topic: Statistics · Scatter diagrams. Worth 8 marks.
Open in interactive question bank →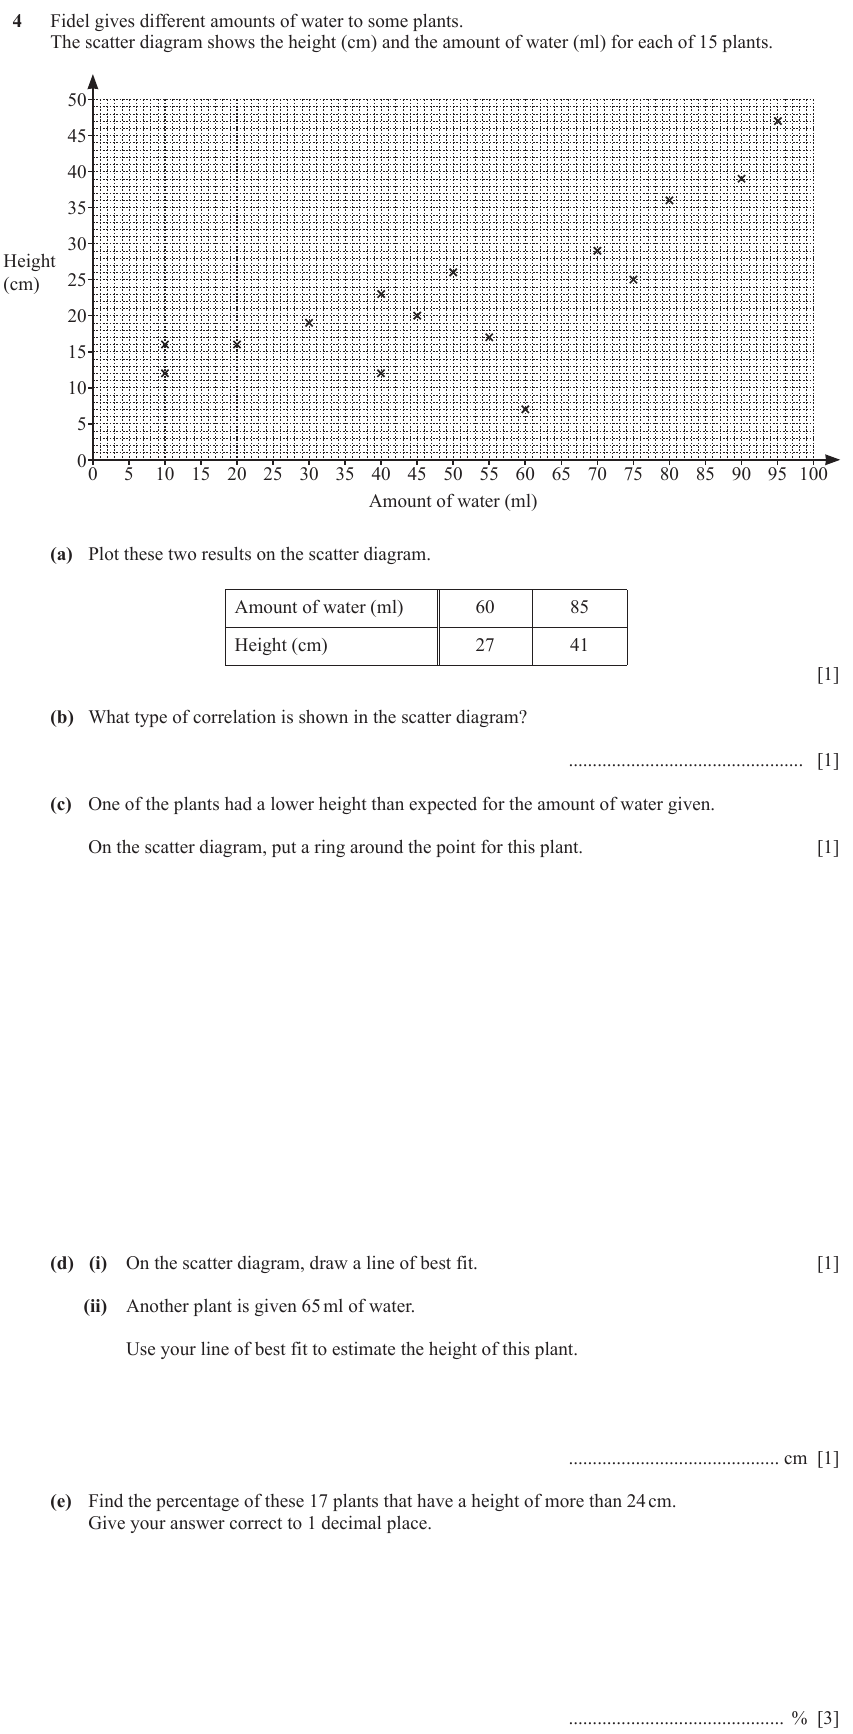
Question text
4 Fidel gives different amounts of water to some plants.
The scatter diagram shows the height (cm) and the amount of water (ml) for each of 15 plants.
50
45
40
35
30
Height
(cm) 25
20
15
10
5
0
0 5 10 15 20 25 30 35 40 45 50 55 60 65 70 75 80 85 90 95 100
Amount of water (ml)
(a) Plot these two results on the scatter diagram.
Amount of water (ml) 60 85
Height (cm) 27 41
[1]
(b) What type of correlation is shown in the scatter diagram?
................................................. [1]
(c) One of the plants had a lower height than expected for the amount of water given.
On the scatter diagram, put a ring around the point for this plant. [1]
© UCLES 2023 0580/32/M/J/23
9
(d) (i) On the scatter diagram, draw a line of best fit. [1]
(ii) Another plant is given 65 ml of water.
Use your line of best fit to estimate the height of this plant.
............................................ cm [1]
(e) Find the percentage of these 17 plants that have a height of more than 24 cm.
Give your answer correct to 1 decimal place.
............................................. % [3]
© UCLES 2023 0580/32/M/J/23 [Turn over
10
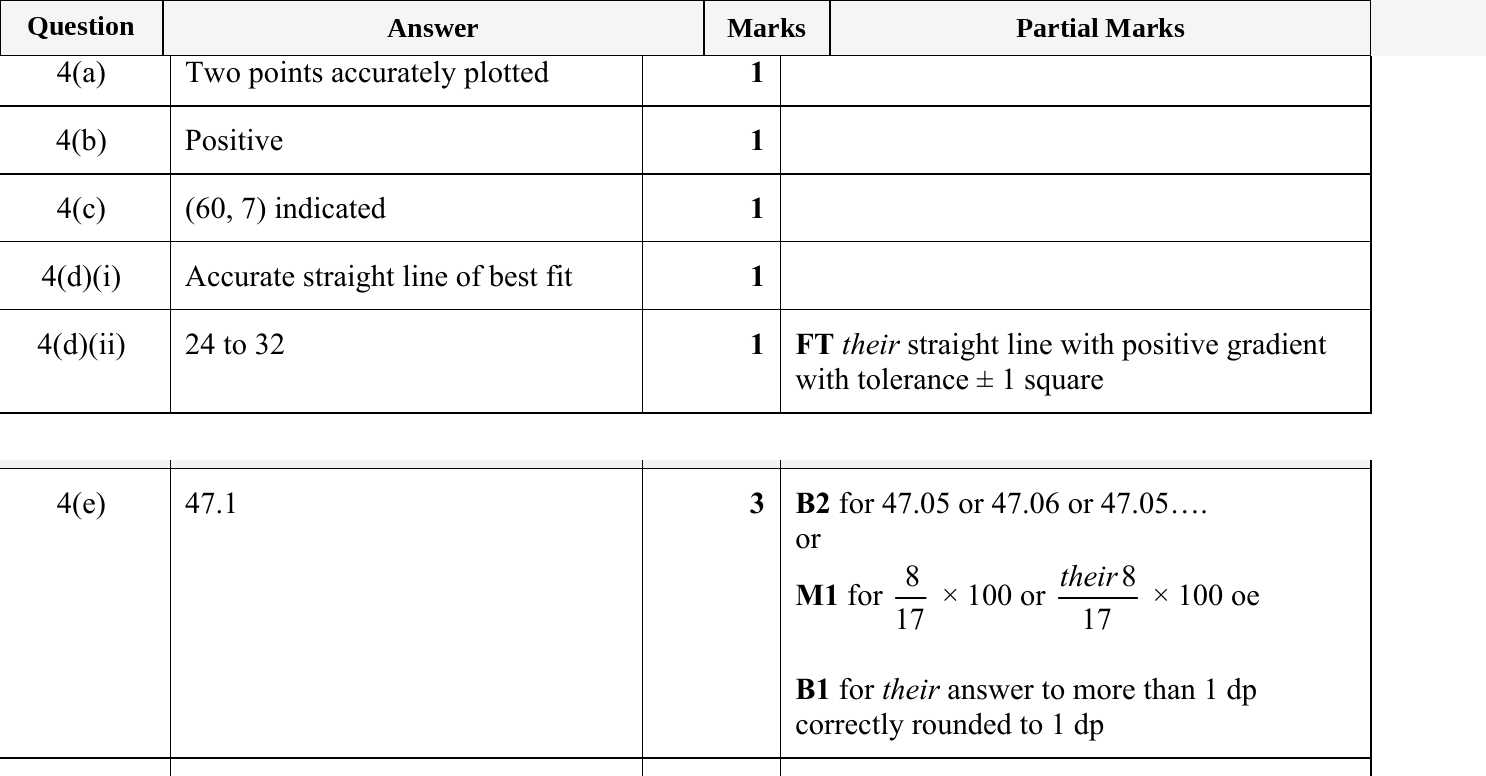
Mark scheme