Question 20 — IGCSE 0580 May/June 2025 Paper 11
Cambridge IGCSE Mathematics 0580, Core tier, non-calculator. Topic: Statistics · Scatter diagrams. Worth 4 marks.
Open in interactive question bank →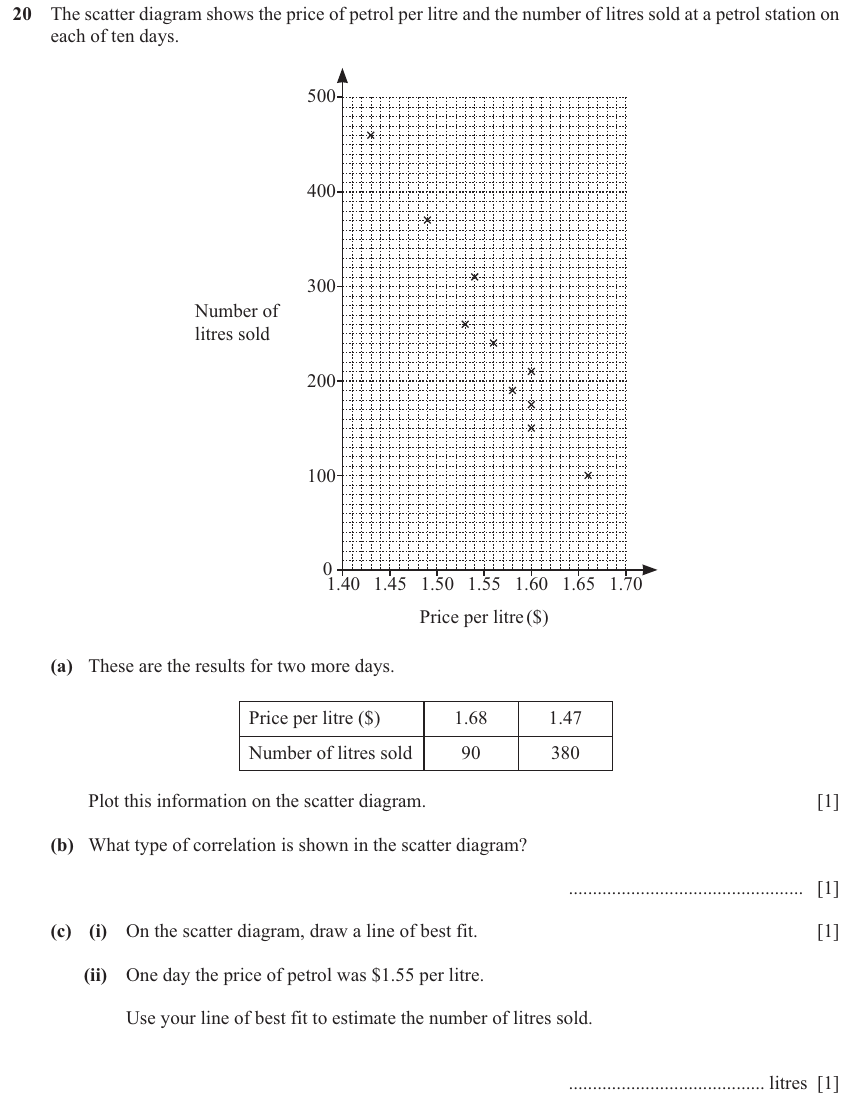
Question text
20 The scatter diagram shows the price of petrol per litre and the number of litres sold at a petrol station on
each of ten days.
500
400
300
Number of
litres sold
200
100
0
1.40 1.45 1.50 1.55 1.60 1.65 1.70
Price per litre ($)
(a) These are the results for two more days.
Price per litre ($) 1.68 1.47
Number of litres sold 90 380
Plot this information on the scatter diagram. [1]
(b) What type of correlation is shown in the scatter diagram?
................................................. [1]
(c) (i) On the scatter diagram, draw a line of best fit. [1]
(ii) One day the price of petrol was $1.55 per litre.
Use your line of best fit to estimate the number of litres sold.
.........................................litres [1]
(cid:300)(cid:209)(cid:266)(cid:174)(cid:288)(cid:180)(cid:237)(cid:200)(cid:245)(cid:207)(cid:298)(cid:197)(cid:266)(cid:222)(cid:249)(cid:184)(cid:256)(cid:215)
© UCLES 2025 (cid:300)(cid:192)(cid:298)(cid:242)(cid:205)(cid:292)(cid:283)(cid:247)(cid:220)(cid:256)(cid:249)(cid:263)(cid:176)(cid:255)(cid:212)(cid:201)(cid:286)(cid:258) 0580/11/M/J/25
(cid:293)(cid:277)(cid:181)(cid:213)(cid:245)(cid:181)(cid:197)(cid:245)(cid:181)(cid:181)(cid:293)(cid:197)(cid:261)(cid:213)(cid:293)(cid:181)(cid:245)(cid:213)
M
SIHT
NI
ETIRW
TON
OD
NIGRAM
SIHT
NI
ETIRW
TON
OD
NIGRAM
SIHT
NI
ETIRW
TON
OD
NIGRAM
SIHT
NI
ETIRW
TON
OD
NIGRAM
SIHT
NI
ETIRW
TON
OD
* 0000800000013 *
13
(cid:44)(cid:1)(cid:1)(cid:1)(cid:1)(cid:9)(cid:1)(cid:1)(cid:1)(cid:1)(cid:1)(cid:1)(cid:2)(cid:4)(cid:44)
NIGRAM
DFD