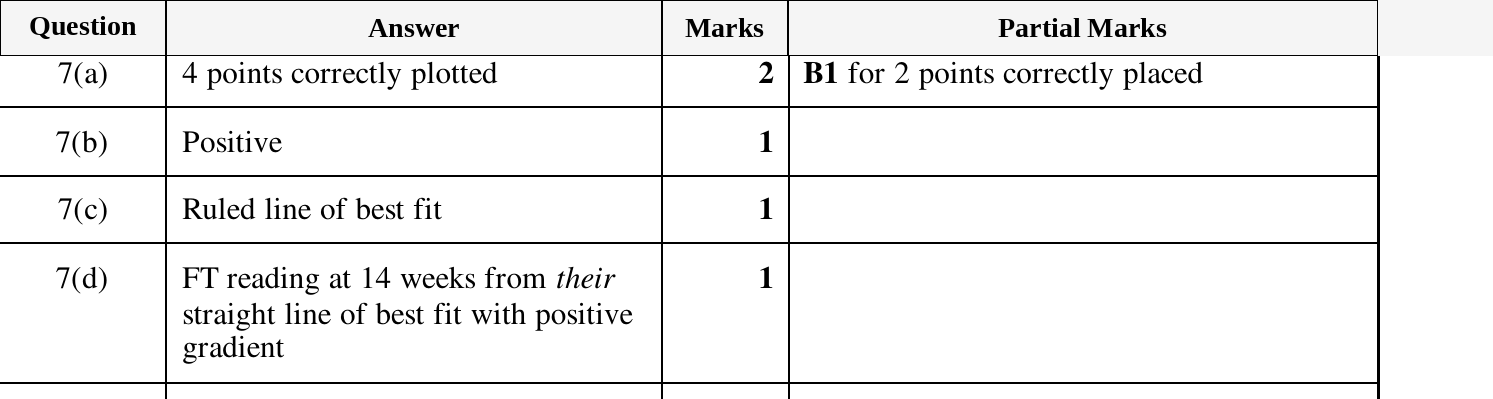
Question 7 — IGCSE 0580 March 2025 Paper 42
Cambridge IGCSE Mathematics 0580, Extended tier, calculator. Topic: Statistics · Scatter diagrams. Worth 5 marks.
Open in interactive question bank →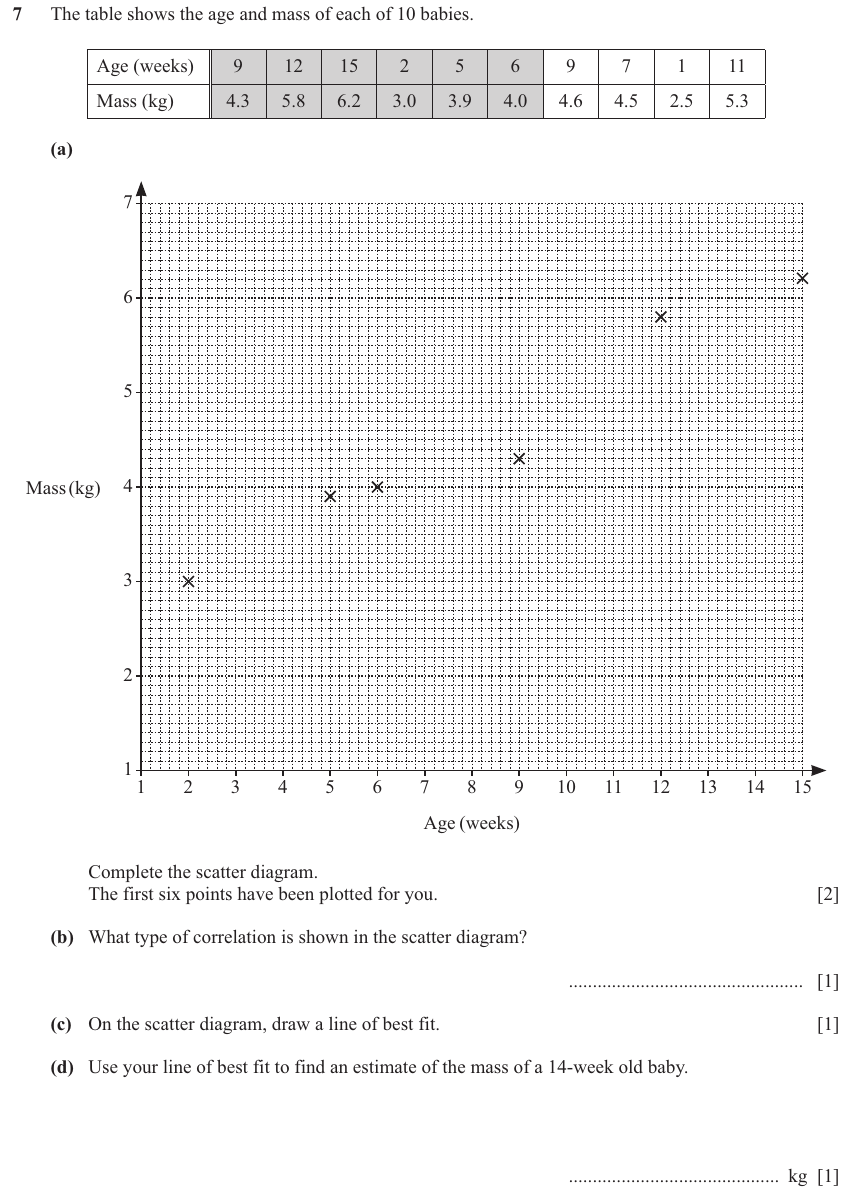
Question text
7 The table shows the age and mass of each of 10 babies.
Age (weeks) 9 12 15 2 5 6 9 7 1 11
Mass (kg) 4.3 5.8 6.2 3.0 3.9 4.0 4.6 4.5 2.5 5.3
(a)
7
6
5
Mass (kg) 4
3
2
1
1 2 3 4 5 6 7 8 9 10 11 12 13 14 15
Age (weeks)
Complete the scatter diagram.
The first six points have been plotted for you. [2]
(b) What type of correlation is shown in the scatter diagram?
................................................. [1]
(c) On the scatter diagram, draw a line of best fit. [1]
(d) Use your line of best fit to find an estimate of the mass of a 14-week old baby.
............................................ kg [1]
(cid:300)(cid:207)(cid:266)(cid:174)(cid:288)(cid:180)(cid:237)(cid:200)(cid:245)(cid:207)(cid:298)(cid:197)(cid:266)(cid:224)(cid:251)(cid:183)(cid:256)(cid:215) [Turn over
© UCLES 2025 (cid:300)(cid:228)(cid:282)(cid:241)(cid:211)(cid:291)(cid:268)(cid:255)(cid:218)(cid:250)(cid:259)(cid:282)(cid:190)(cid:189)(cid:204)(cid:186)(cid:265)(cid:258) 0580/42/F/M/25
(cid:293)(cid:213)(cid:213)(cid:213)(cid:245)(cid:181)(cid:293)(cid:277)(cid:245)(cid:261)(cid:261)(cid:197)(cid:197)(cid:277)(cid:229)(cid:245)(cid:213)(cid:213)
M
SIHT
NI
ETIRW
TON
OD
NIGRAM
SIHT
NI
ETIRW
TON
OD
NIGRAM
SIHT
NI
ETIRW
TON
OD
NIGRAM
SIHT
NI
ETIRW
TON
OD
NIGRAM
SIHT
NI
ETIRW
TON
OD
* 0000800000006 *
6
(cid:44)(cid:1)(cid:1)(cid:1)(cid:1)(cid:9)(cid:1)(cid:1)(cid:1)(cid:1)(cid:1)(cid:1)(cid:1)(cid:7)(cid:44)
NIGRAM
Mark scheme