Question 16 — IGCSE 0580 March 2025 Paper 12
Cambridge IGCSE Mathematics 0580, Core tier, non-calculator. Topic: Statistics · Scatter diagrams. Worth 2 marks.
Open in interactive question bank →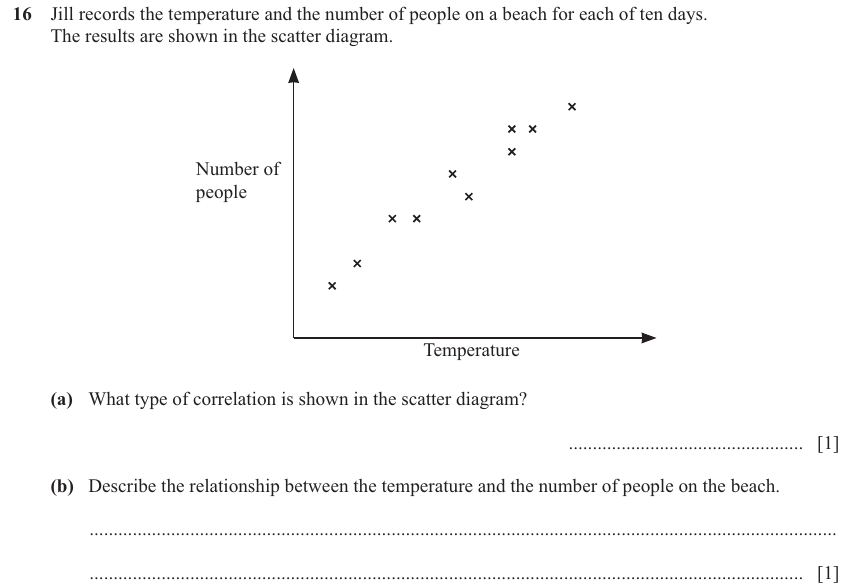
Question text
16 Jill records the temperature and the number of people on a beach for each of ten days.
The results are shown in the scatter diagram.
Number of
people
Temperature
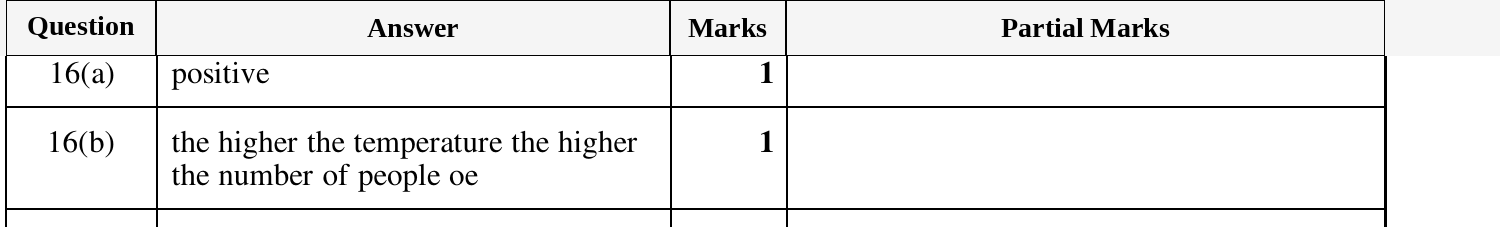
(a) What type of correlation is shown in the scatter diagram?
................................................. [1]
(b) Describe the relationship between the temperature and the number of people on the beach.
............................................................................................................................................................
..................................................................................................................................................... [1]
(cid:300)(cid:219)(cid:266)(cid:174)(cid:288)(cid:180)(cid:237)(cid:200)(cid:245)(cid:207)(cid:298)(cid:197)(cid:266)(cid:221)(cid:252)(cid:183)(cid:254)(cid:215) [Turn over
© UCLES 2025 (cid:300)(cid:200)(cid:240)(cid:243)(cid:212)(cid:287)(cid:283)(cid:244)(cid:218)(cid:268)(cid:253)(cid:226)(cid:189)(cid:181)(cid:249)(cid:242)(cid:300)(cid:258) 0580/12/F/M/25
(cid:293)(cid:229)(cid:213)(cid:277)(cid:181)(cid:245)(cid:261)(cid:277)(cid:213)(cid:197)(cid:229)(cid:261)(cid:261)(cid:181)(cid:197)(cid:213)(cid:293)(cid:213)
M
SIHT
NI
ETIRW
TON
OD
NIGRAM
SIHT
NI
ETIRW
TON
OD
NIGRAM
SIHT
NI
ETIRW
TON
OD
NIGRAM
SIHT
NI
ETIRW
TON
OD
NIGRAM
SIHT
NI
ETIRW
TON
OD
* 0000800000012 *
12
(cid:44)(cid:1)(cid:1)(cid:1)(cid:1)(cid:9)(cid:1)(cid:1)(cid:1)(cid:1)(cid:1)(cid:1)(cid:2)(cid:3)(cid:44)
NIGRAM
Mark scheme