Question 15 — IGCSE 0580 Specimen 2025 Paper 11
Cambridge IGCSE Mathematics 0580, Core tier, non-calculator. Topic: Statistics · Scatter diagrams. Worth 8 marks.
Open in interactive question bank →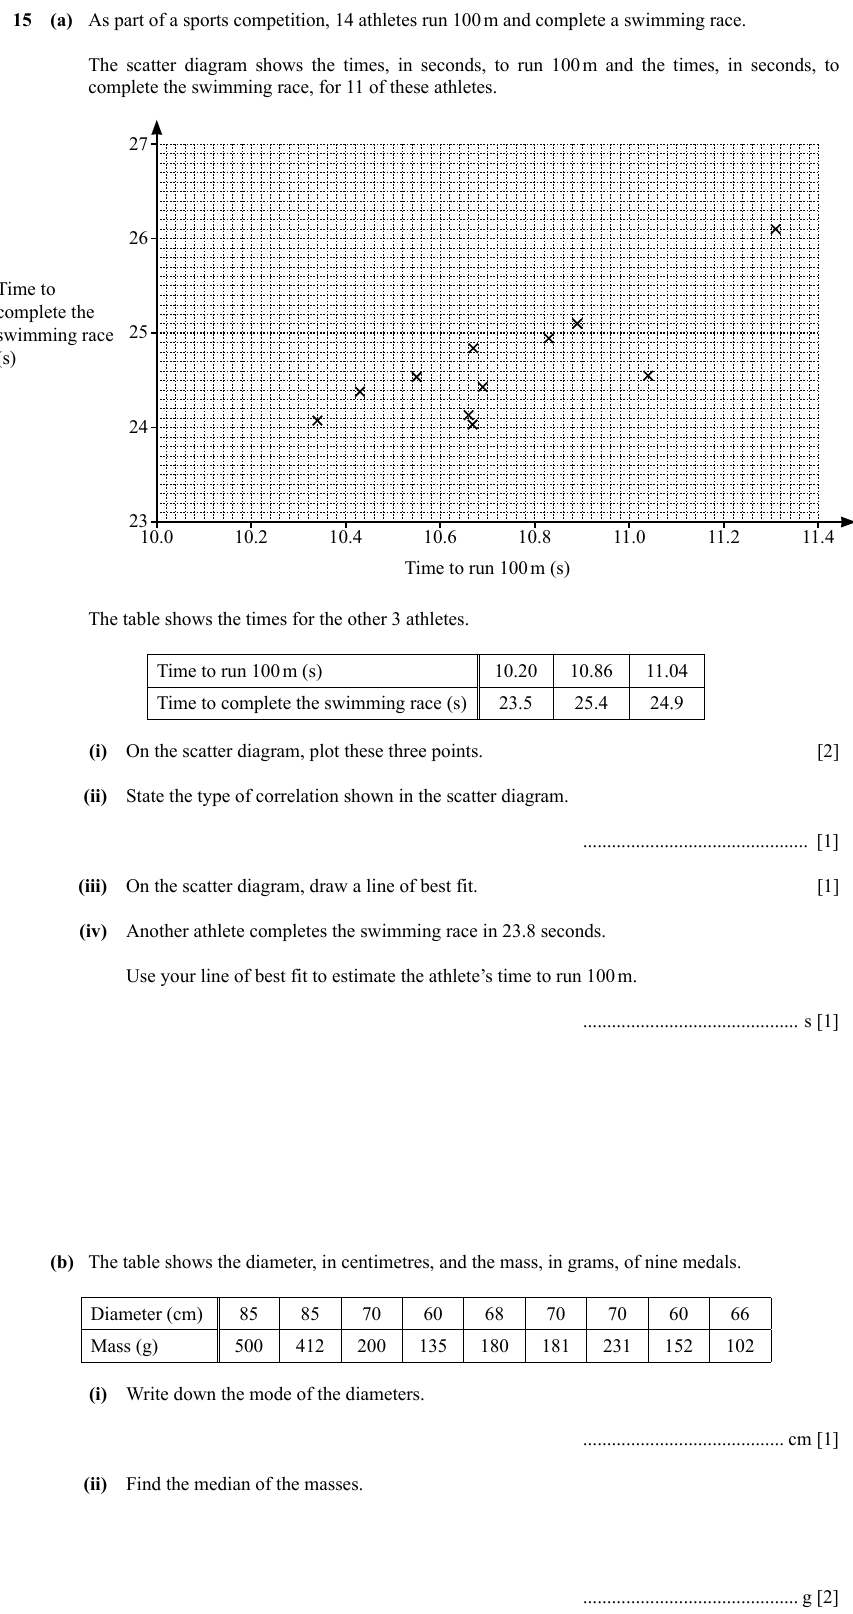
Question text
15 (a) As part of a sports competition, 14 athletes run 100 m and complete a swimming race.
The scatter diagram shows the times, in seconds, to run 100 m and the times, in seconds, to
complete the swimming race, for 11 of these athletes.
27
26
Time to
complete the
swimming race 25
(s)
24
23
10.0 10.2 10.4 10.6 10.8 11.0 11.2 11.4
Time to run 100 m (s)
The table shows the times for the other 3 athletes.
Time to run 100 m (s) 10.20 10.86 11.04
Time to complete the swimming race (s) 23.5 25.4 24.9
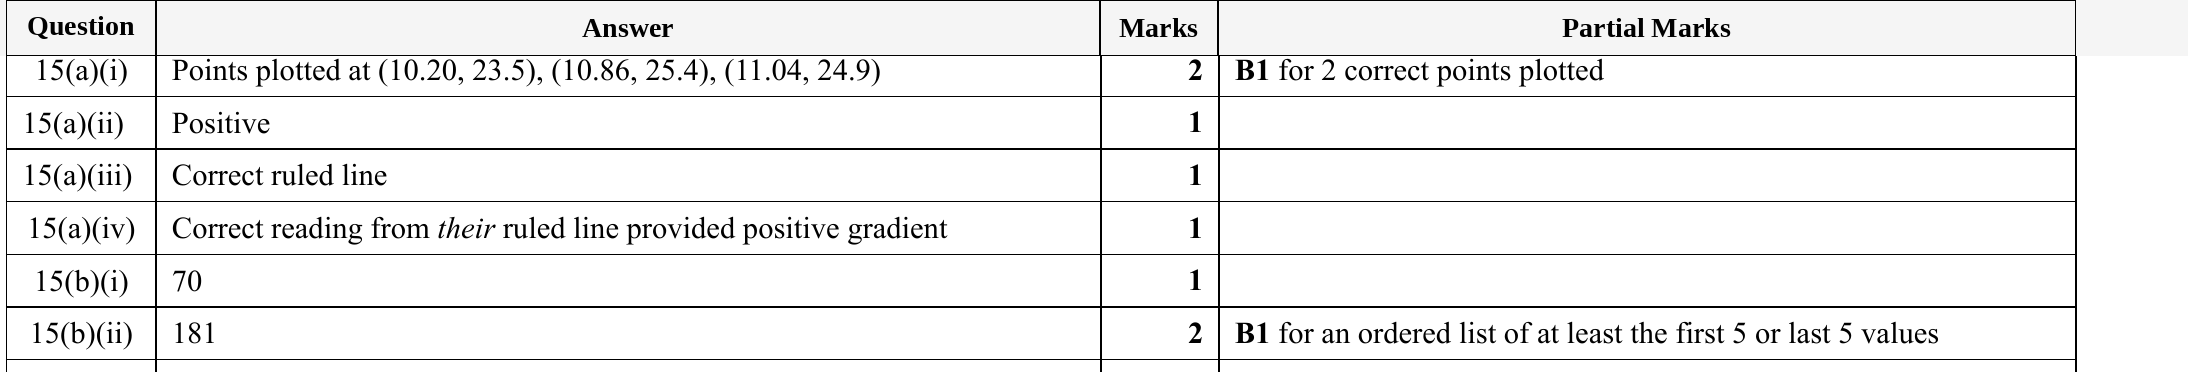
(i) On the scatter diagram, plot these three points. [2]
(ii) State the type of correlation shown in the scatter diagram.
............................................... [1]
(iii) On the scatter diagram, draw a line of best fit. [1]
(iv) Another athlete completes the swimming race in 23.8 seconds.
Use your line of best fit to estimate the athlete’s time to run 100 m.
............................................. s [1]
© Cambridge University Press & Assessment 2022 0580/01/SP/25
11
(b) The table shows the diameter, in centimetres, and the mass, in grams, of nine medals.
Diameter (cm) 85 85 70 60 68 70 70 60 66
Mass (g) 500 412 200 135 180 181 231 152 102
(i) Write down the mode of the diameters.
.......................................... cm [1]
(ii) Find the median of the masses.
............................................. g [2]
© Cambridge University Press & Assessment 2022 0580/01/SP/25 [Turn over
12
Mark scheme