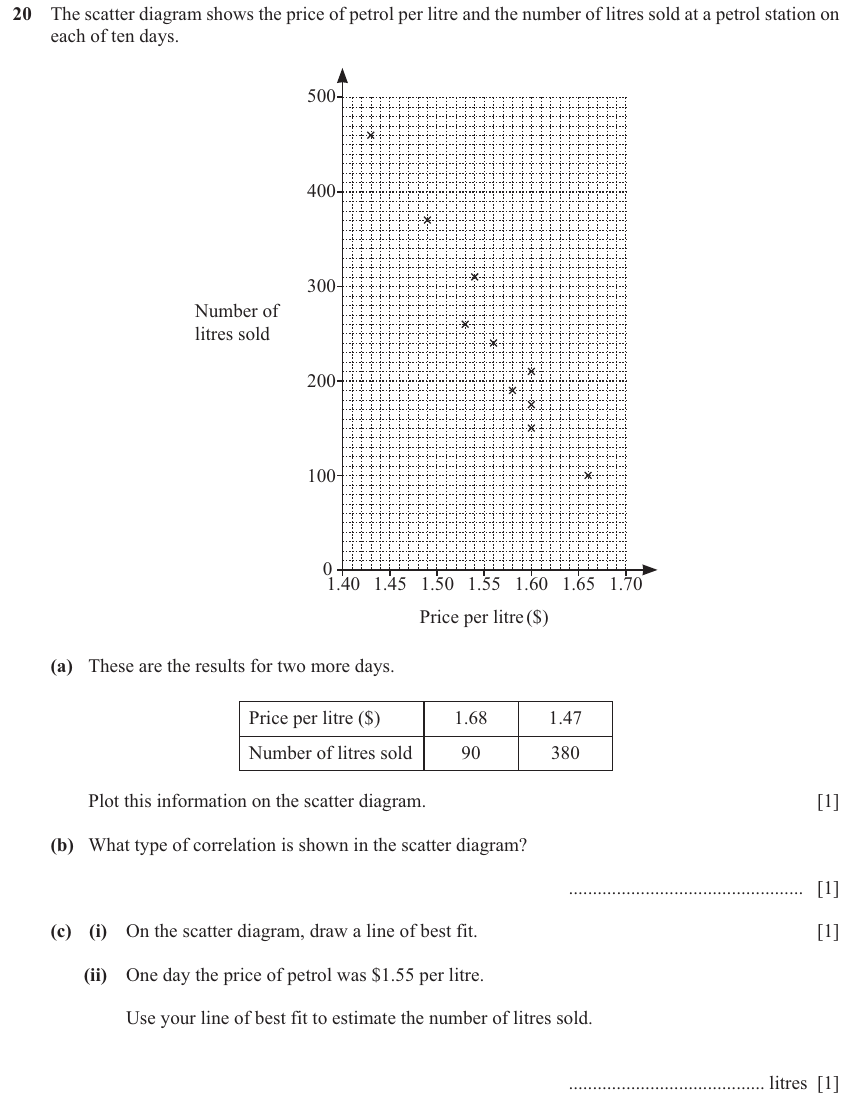
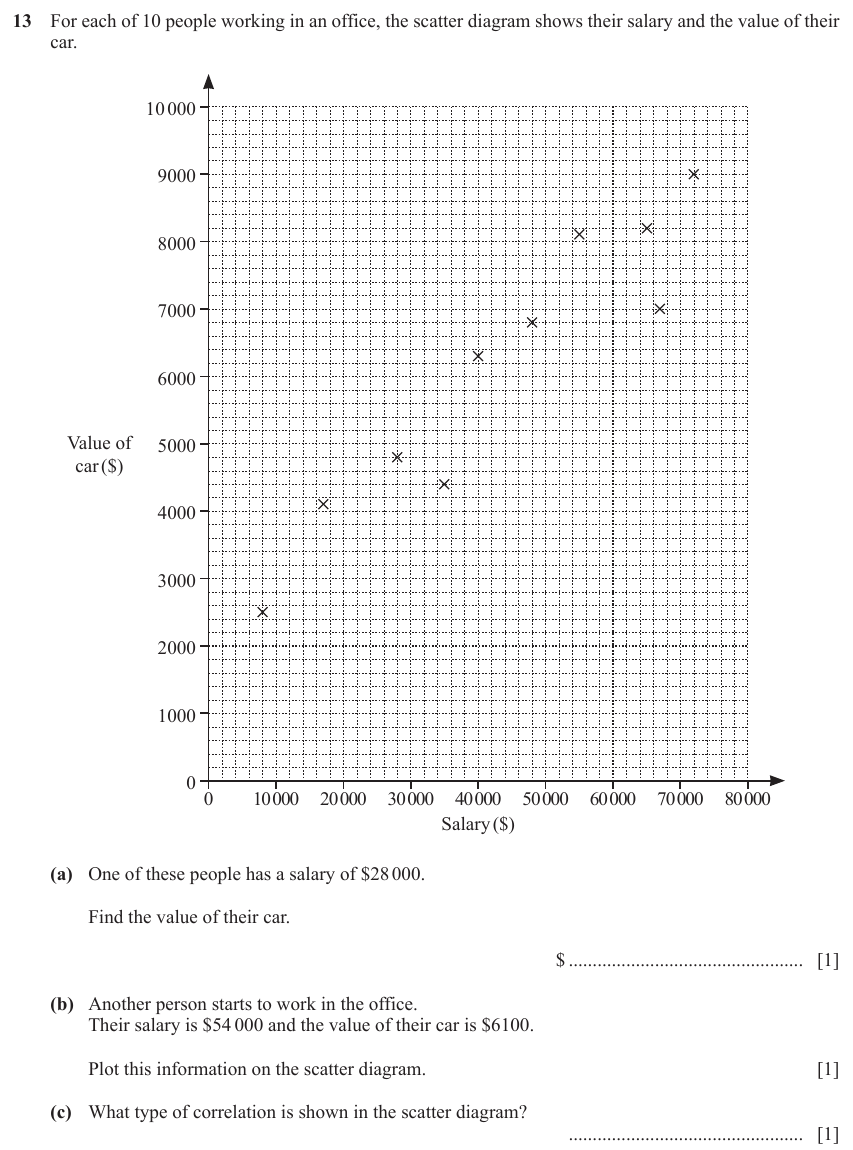
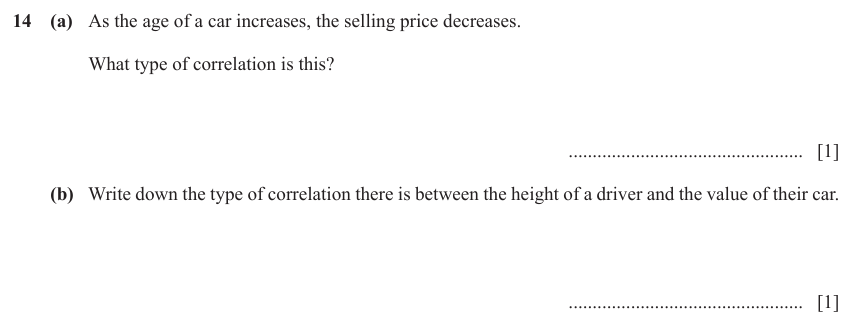
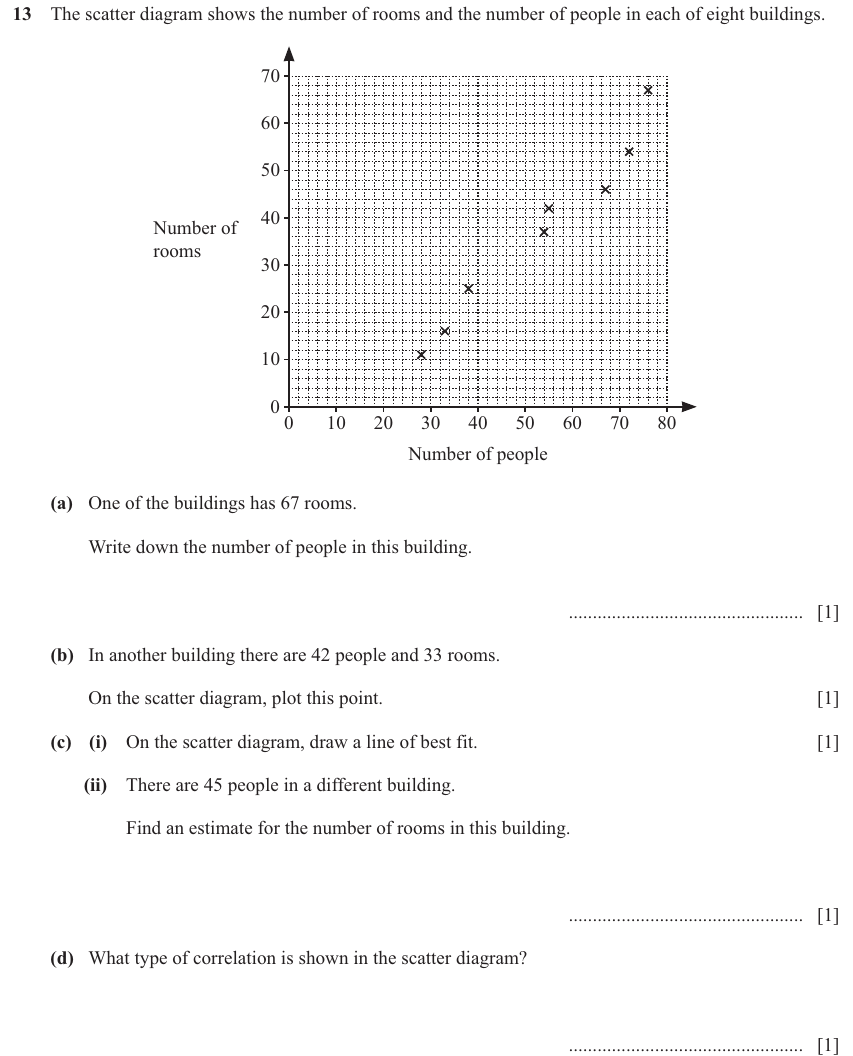
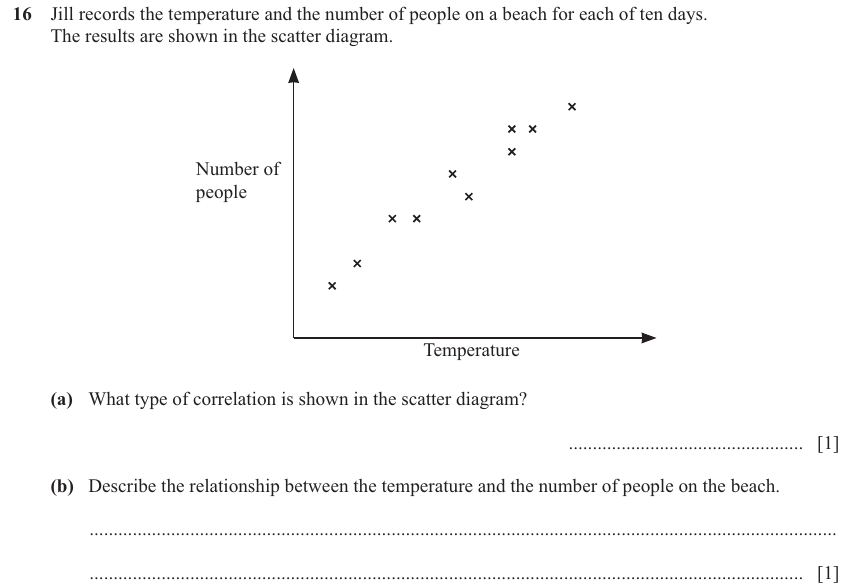
Exercise 1 — Cambridge IGCSE 0580 Mar 2025 Paper 12 Q16
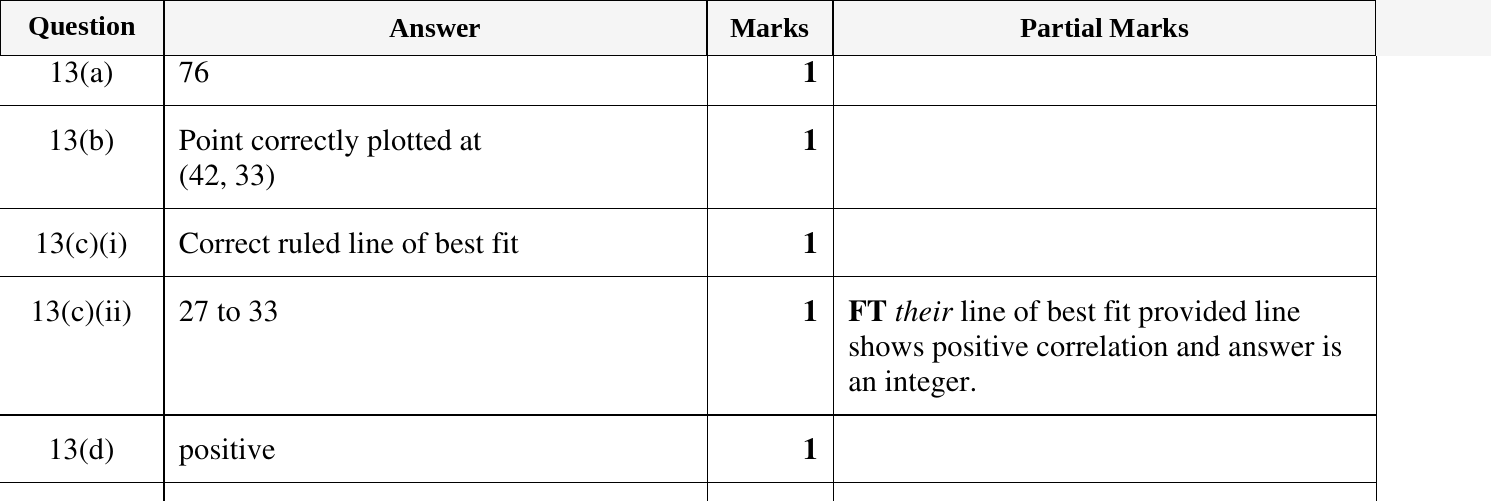
Show mark scheme

Mean = Σfx ÷ Σf (for frequency tables)Range = maximum − minimumInterquartile range (IQR) = Q3 − Q1Median from cumulative frequency: read off at n/2Q1 at n/4; Q3 at 3n/4Frequency density = frequency ÷ class width (for histograms)7 Cambridge IGCSE 0580 questions on scatter diagrams at the Core tier — each with its full mark scheme. For the Extended tier on the same skill, click here.
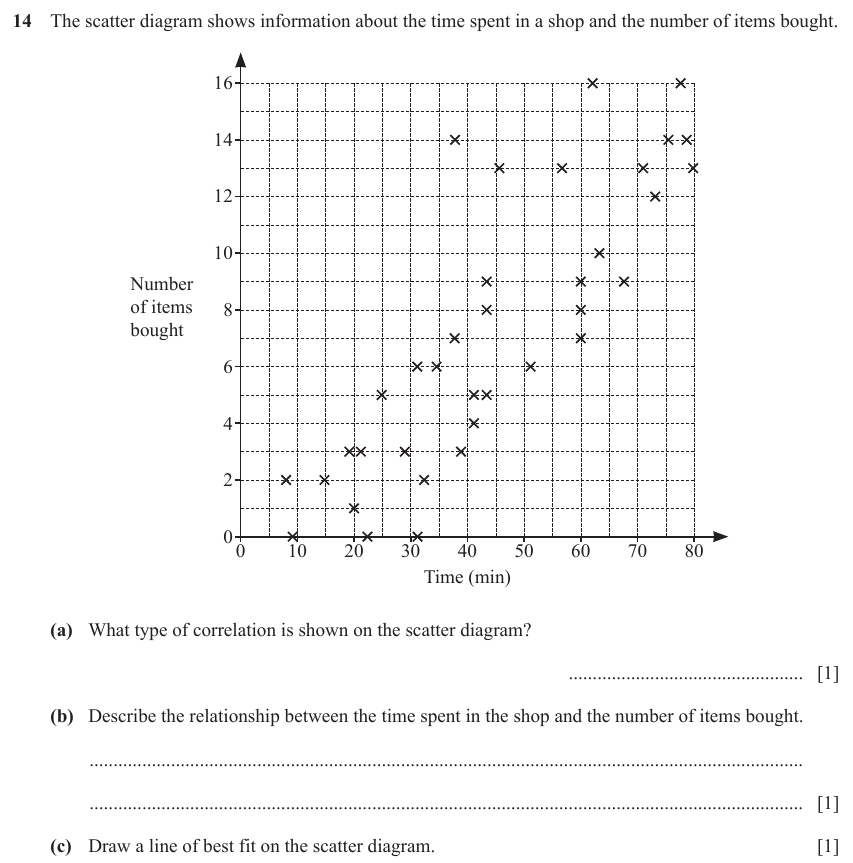
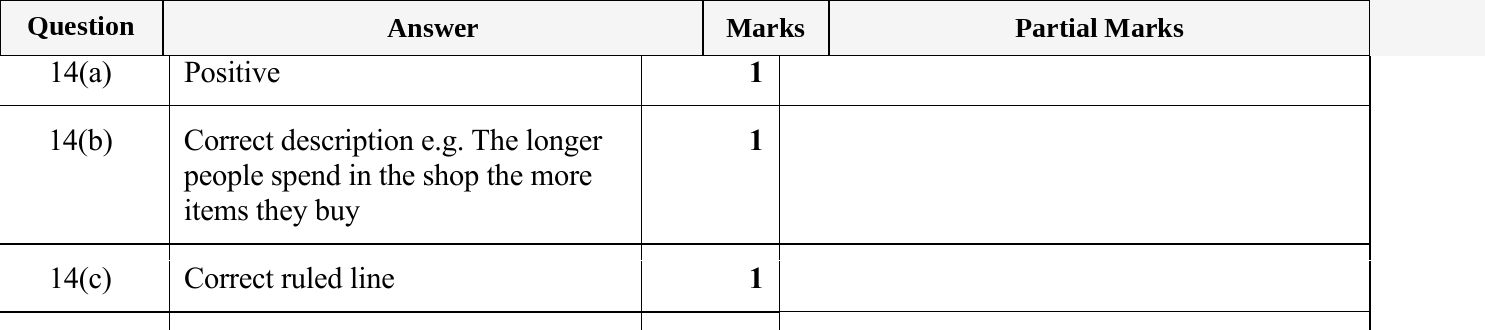
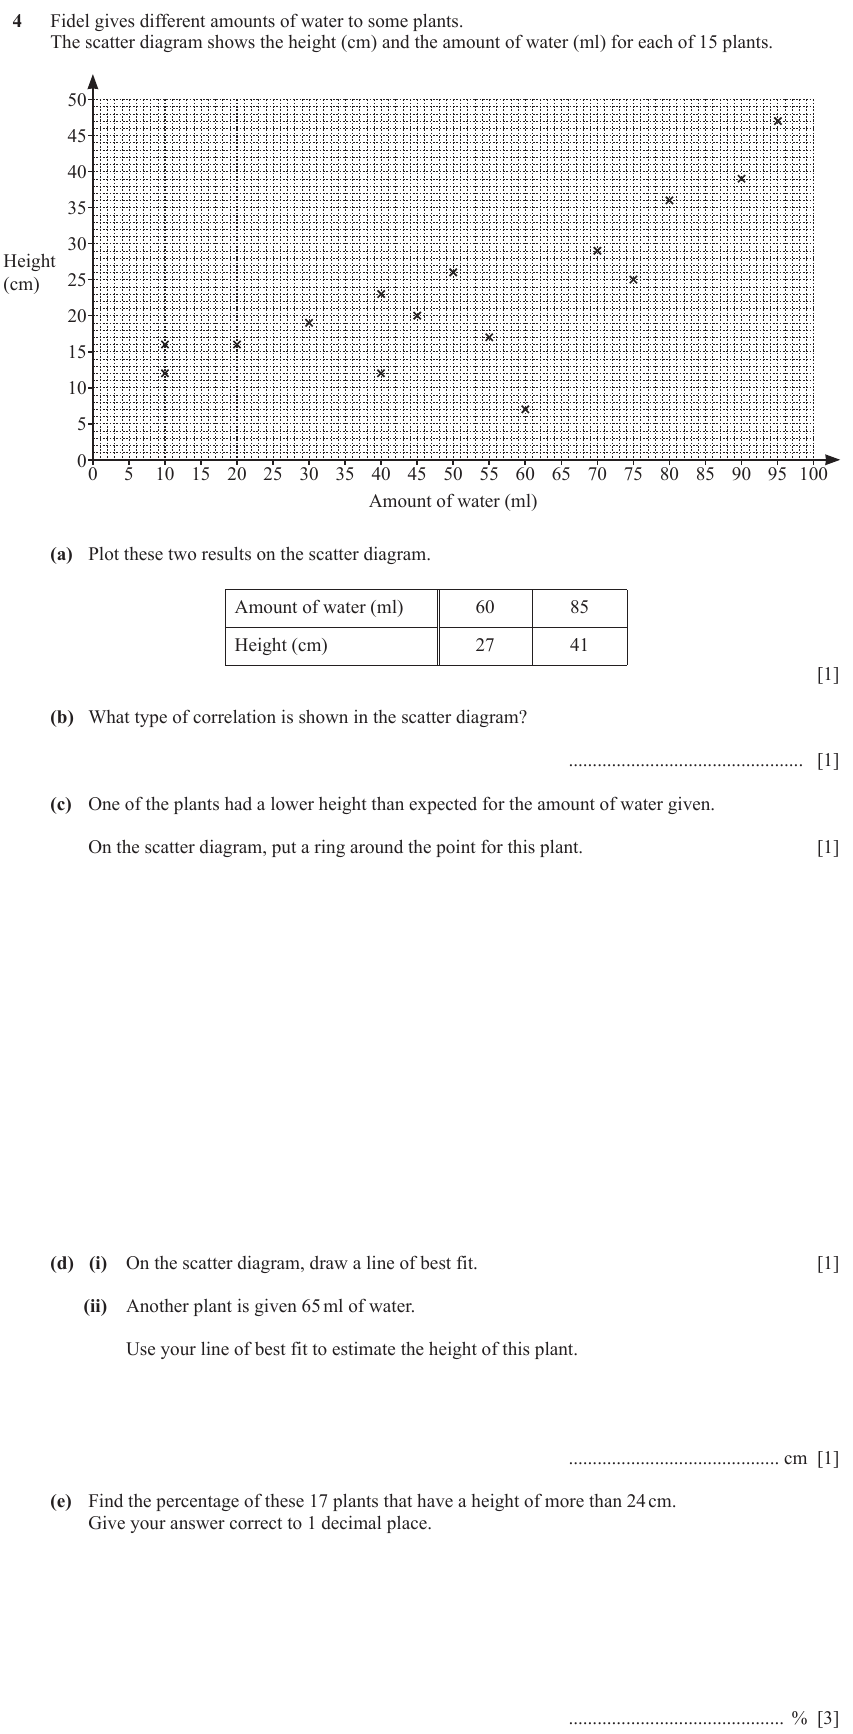
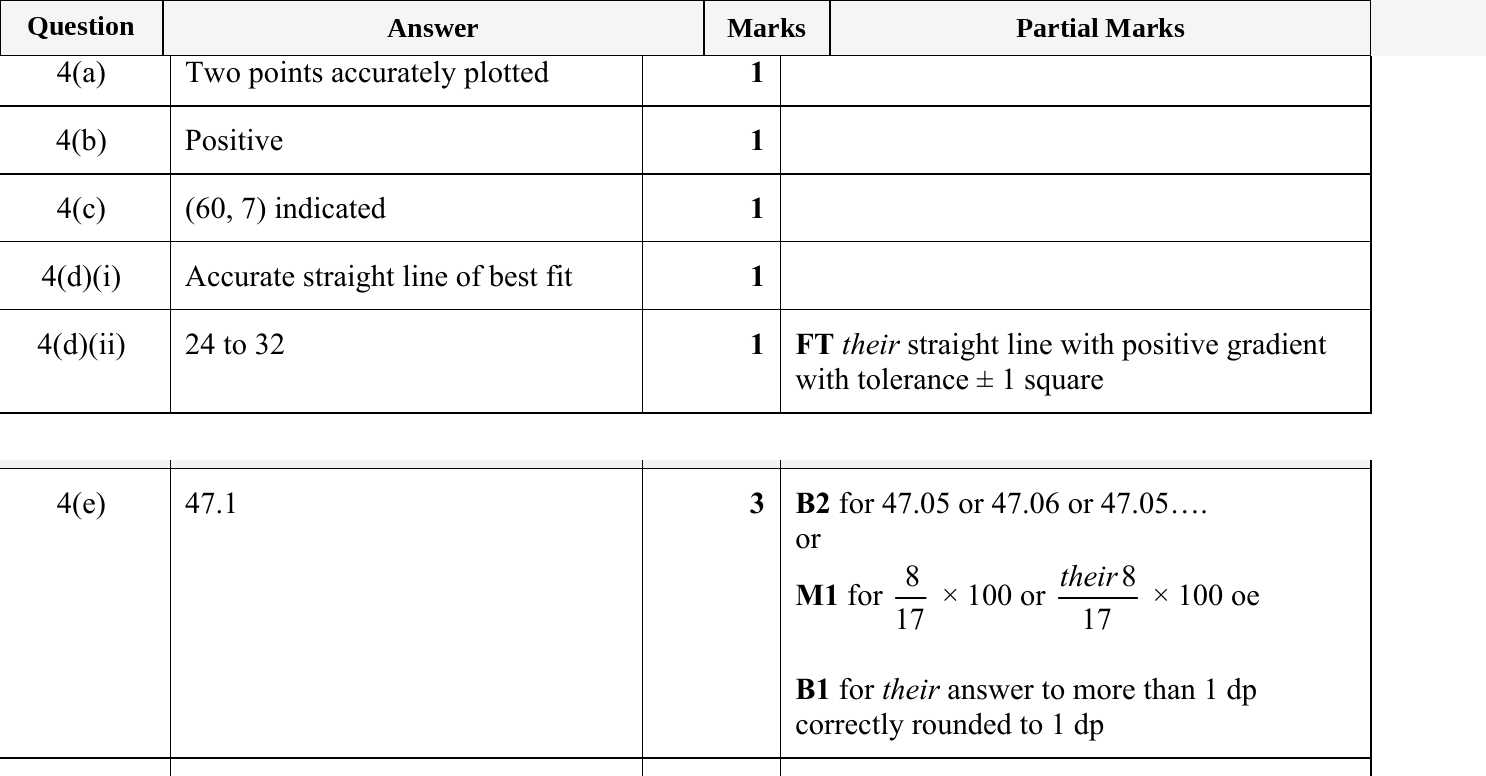
Practice with past paper questions on scatter diagrams at the Core tier.