IGCSE Practice

Cambridge IGCSE·Mathematics 0580·Core Grouped Data
📋Key knowledge — Statistics

Formulas & equations

  • Mean = Σfx ÷ Σf (for frequency tables)
  • Range = maximum − minimum
  • Interquartile range (IQR) = Q3 − Q1
  • Median from cumulative frequency: read off at n/2
  • Q1 at n/4; Q3 at 3n/4
  • Frequency density = frequency ÷ class width (for histograms)

Key facts & rules

  • Mean uses all values — affected by outliers.
  • Median is the middle value when ordered — not affected by outliers.
  • Mode is the most frequent value.
  • For grouped data: use midpoints to estimate the mean.
  • Cumulative frequency graph: S-shaped curve; read median and quartiles from it.
  • Box-and-whisker plots: show median, Q1, Q3, min and max.
  • Positive correlation: both variables increase together. Negative: one increases as other decreases.
  • The line of best fit passes through the mean point (x̄, ȳ).

IGCSE Statistics — Grouped data Practice Core

1 Cambridge IGCSE 0580 questions on grouped data at the Core tier — each with its full mark scheme. For the Extended tier on the same skill, click here.

How to approach grouped data — open the study guide

Grouped data on IGCSE 0580

Estimated mean = Σ(midpoint × frequency) ÷ total frequency. The modal class is the interval with the highest frequency. The median class contains the middle value — use cumulative frequencies to find it.

Practice exercises

Exercise 1 — Cambridge IGCSE 0580 Nov 2024 Paper 31 Q3
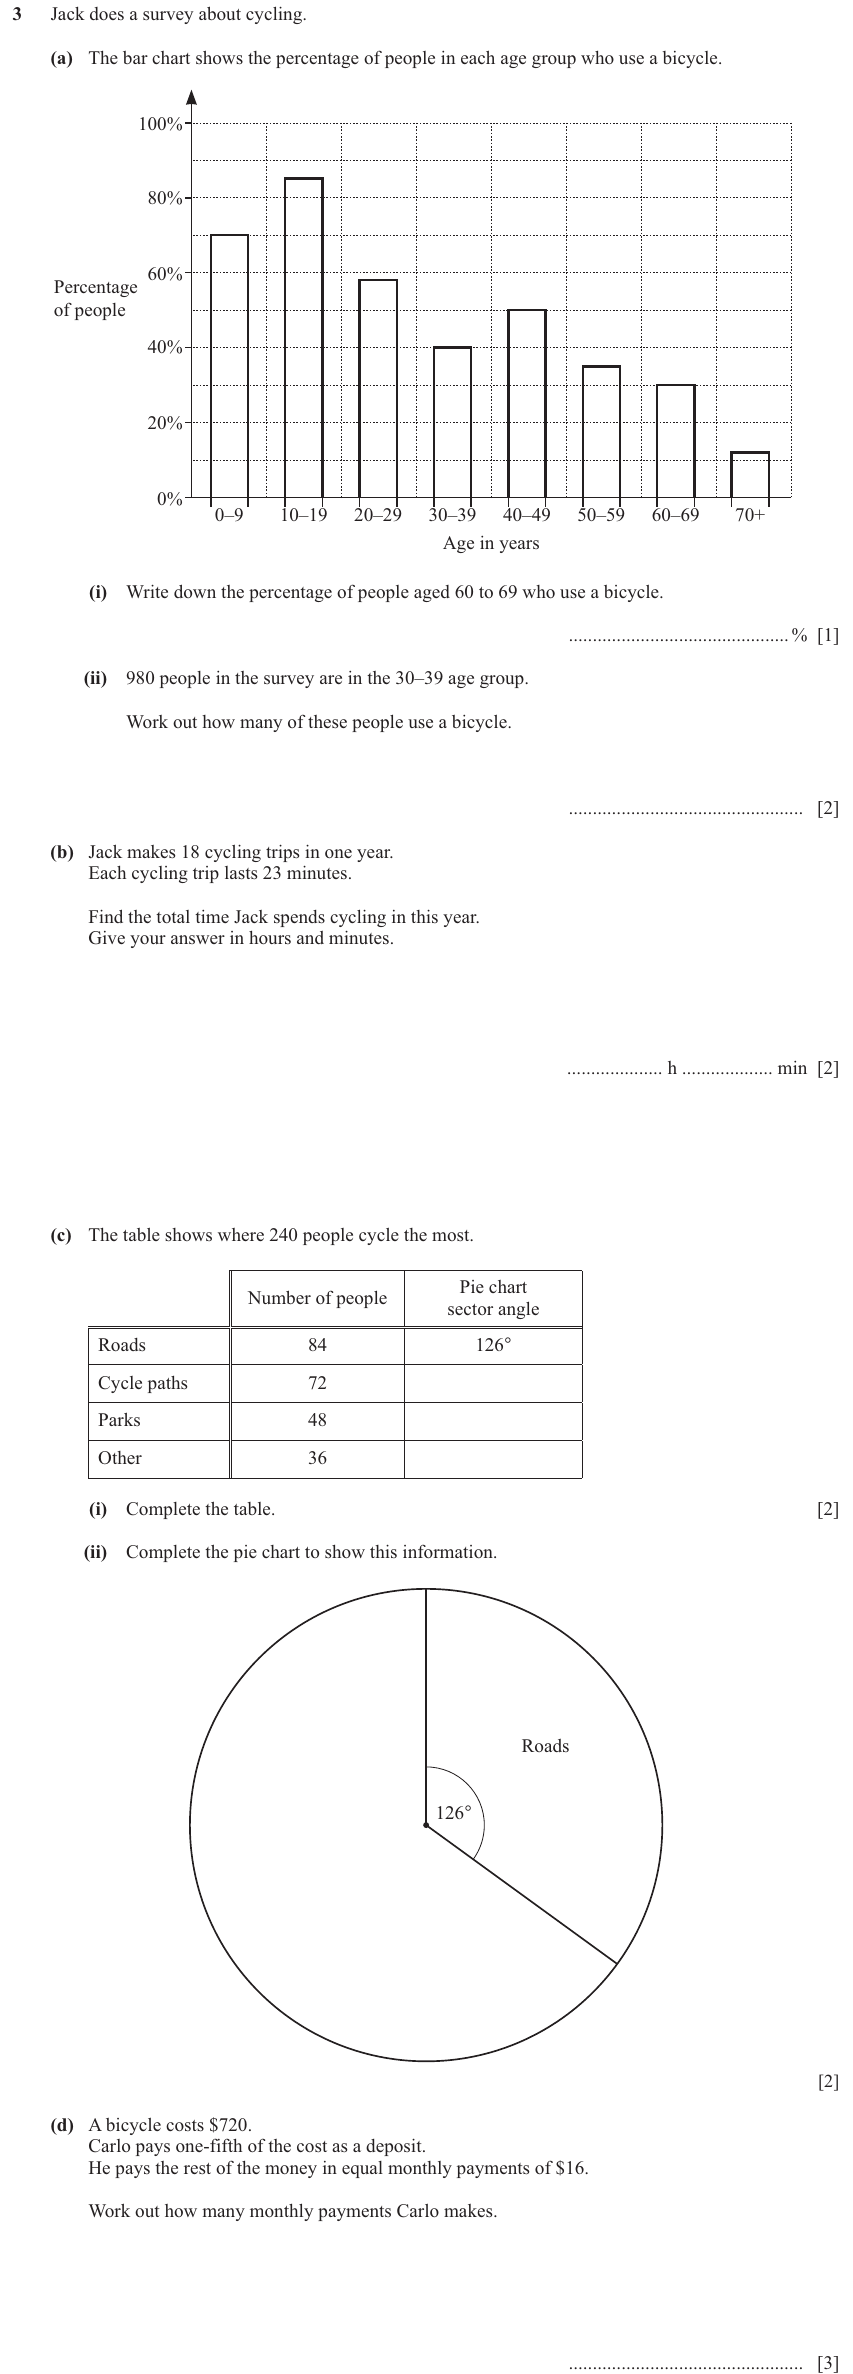
Cambridge past paper 0 marks Paper 31 Nov 2024
IGCSE 0580 Nov 2024 Paper 31 Question 3 — Grouped data (Core, 0 marks)
Show mark scheme
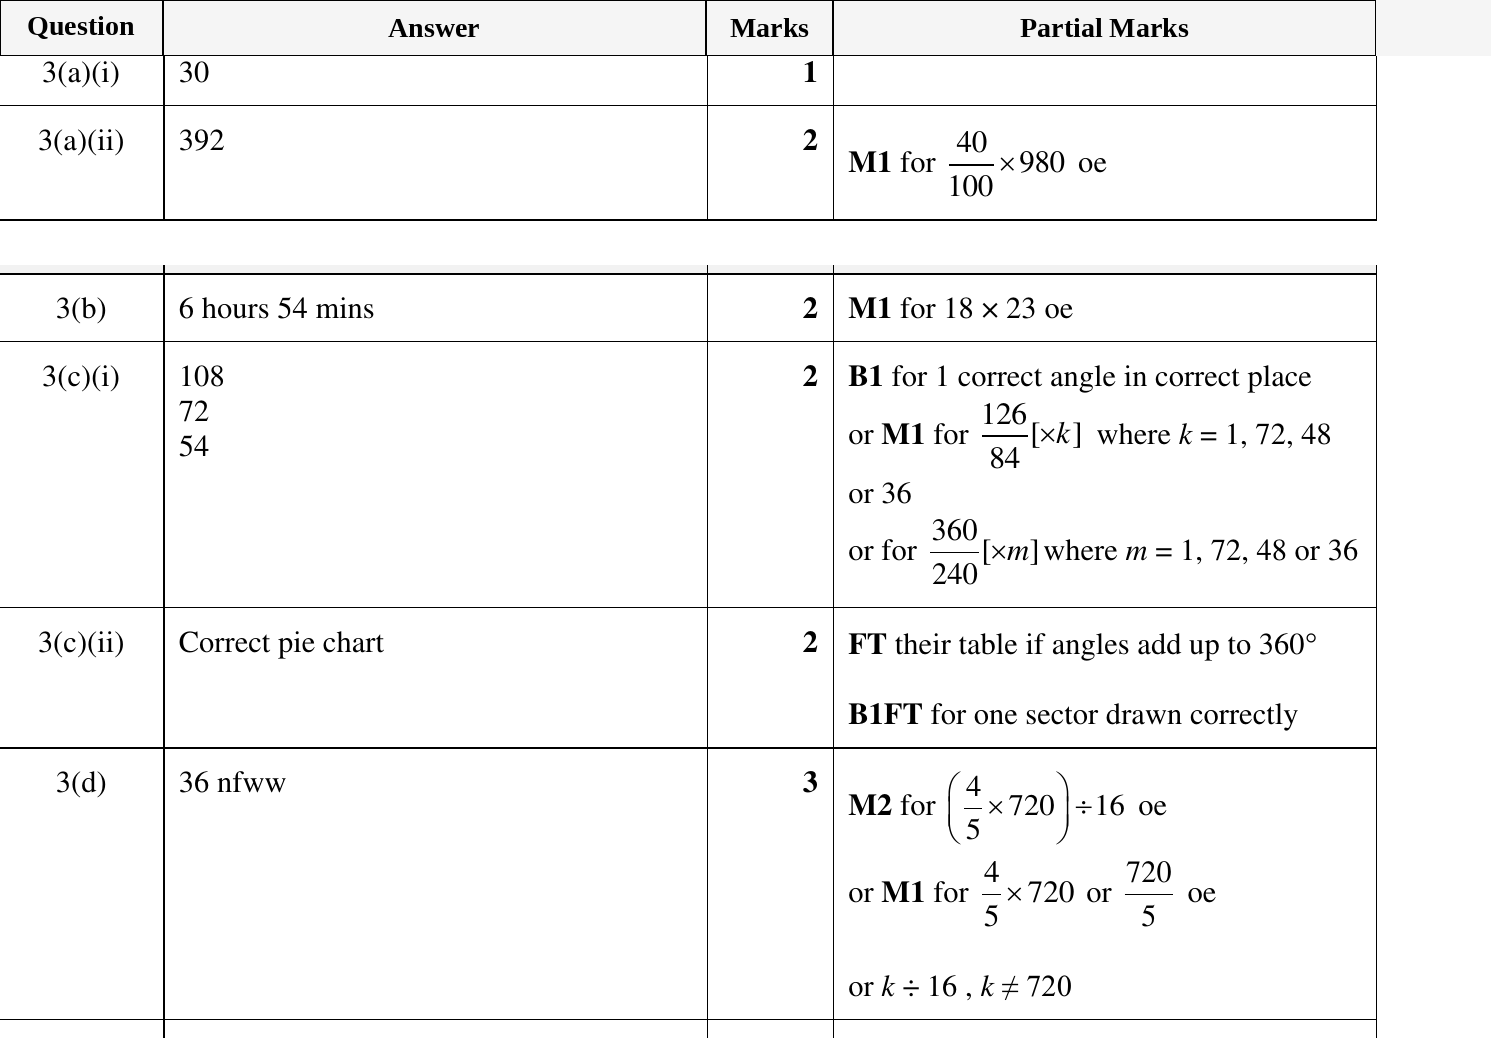
Mark scheme for IGCSE 0580 Nov 2024 Paper 31 Q3

Other Statistics subtopics