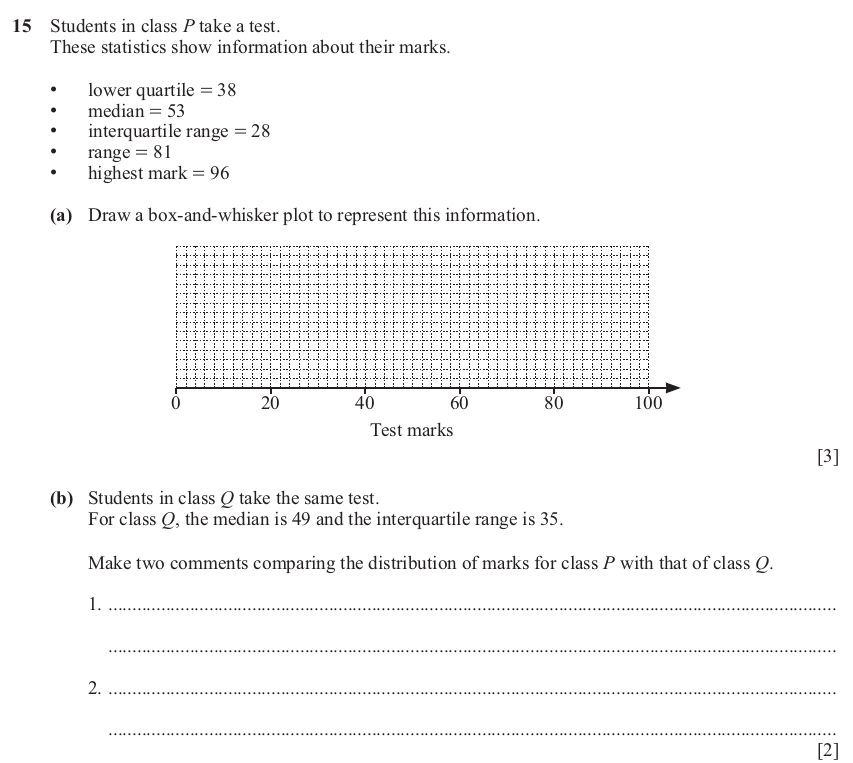
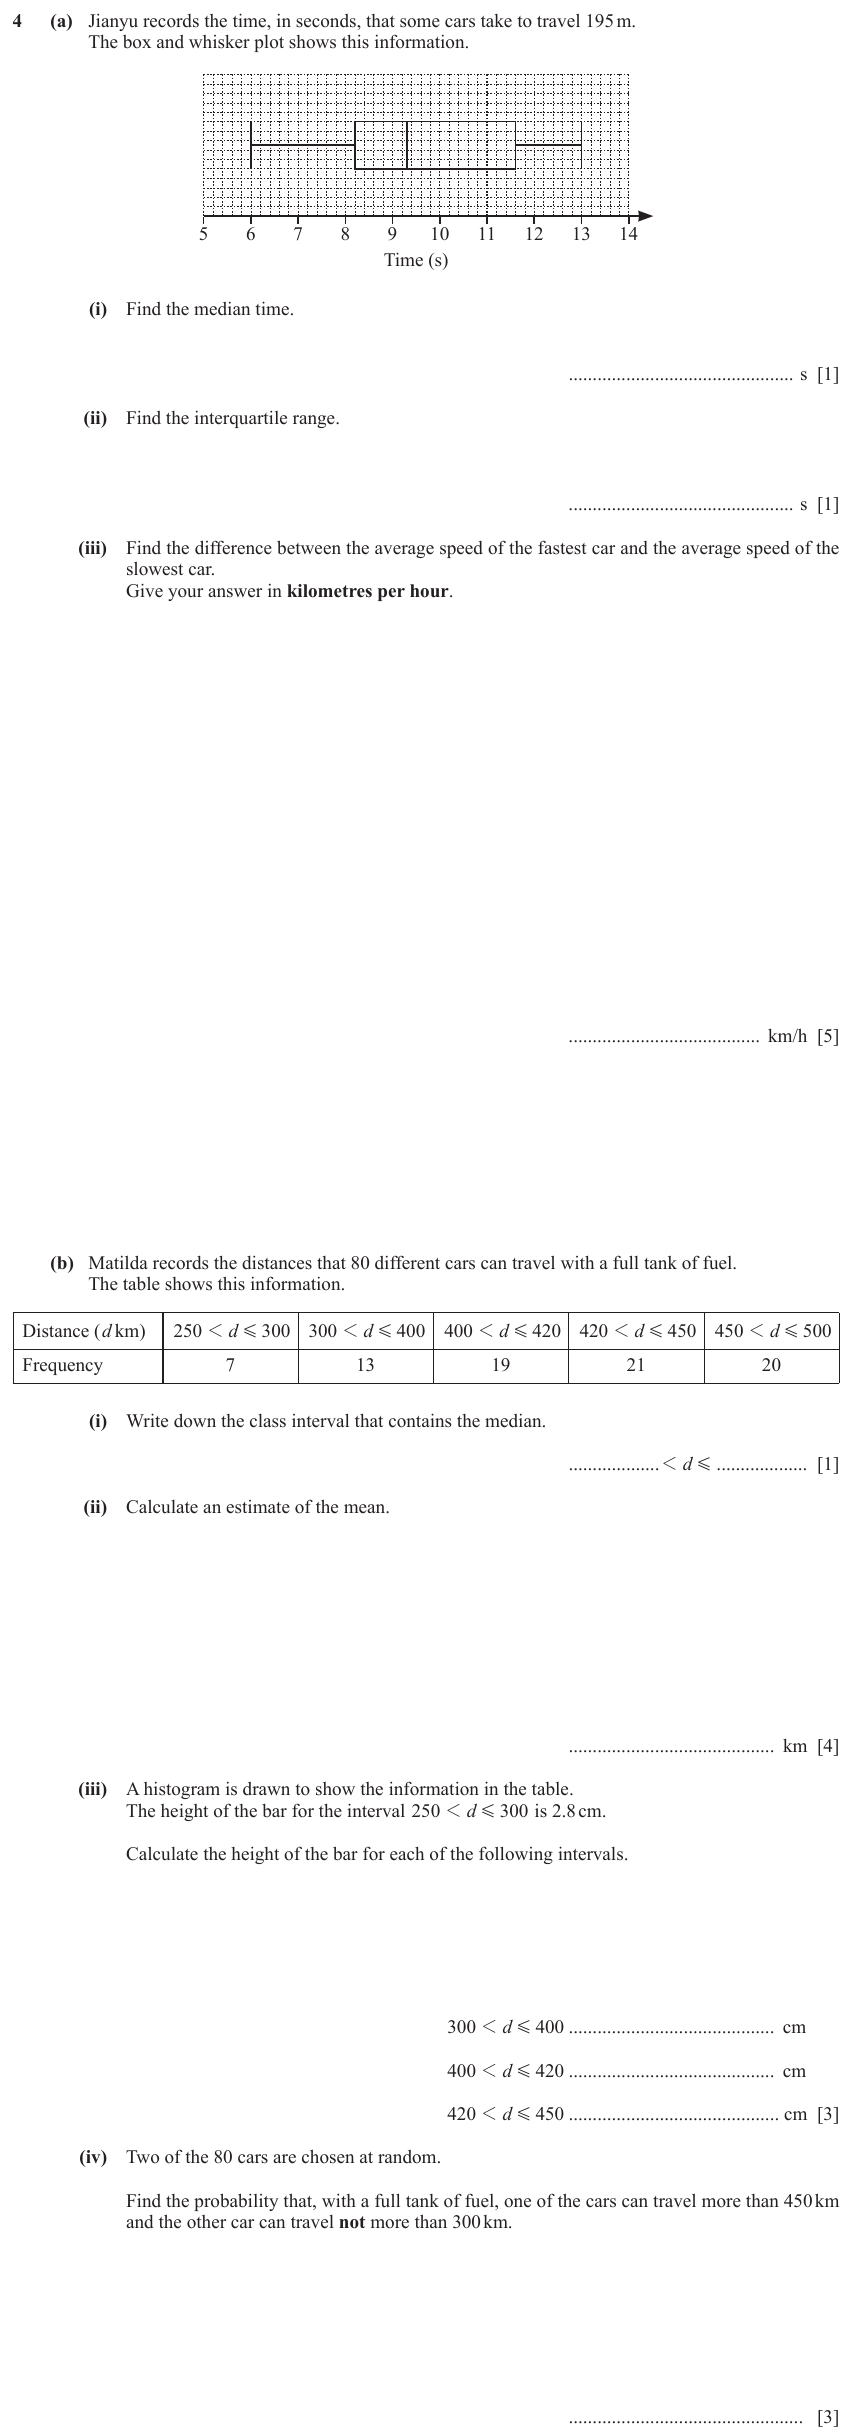
Exercise 1 — Cambridge IGCSE 0580 Jun 2024 Paper 41 Q4
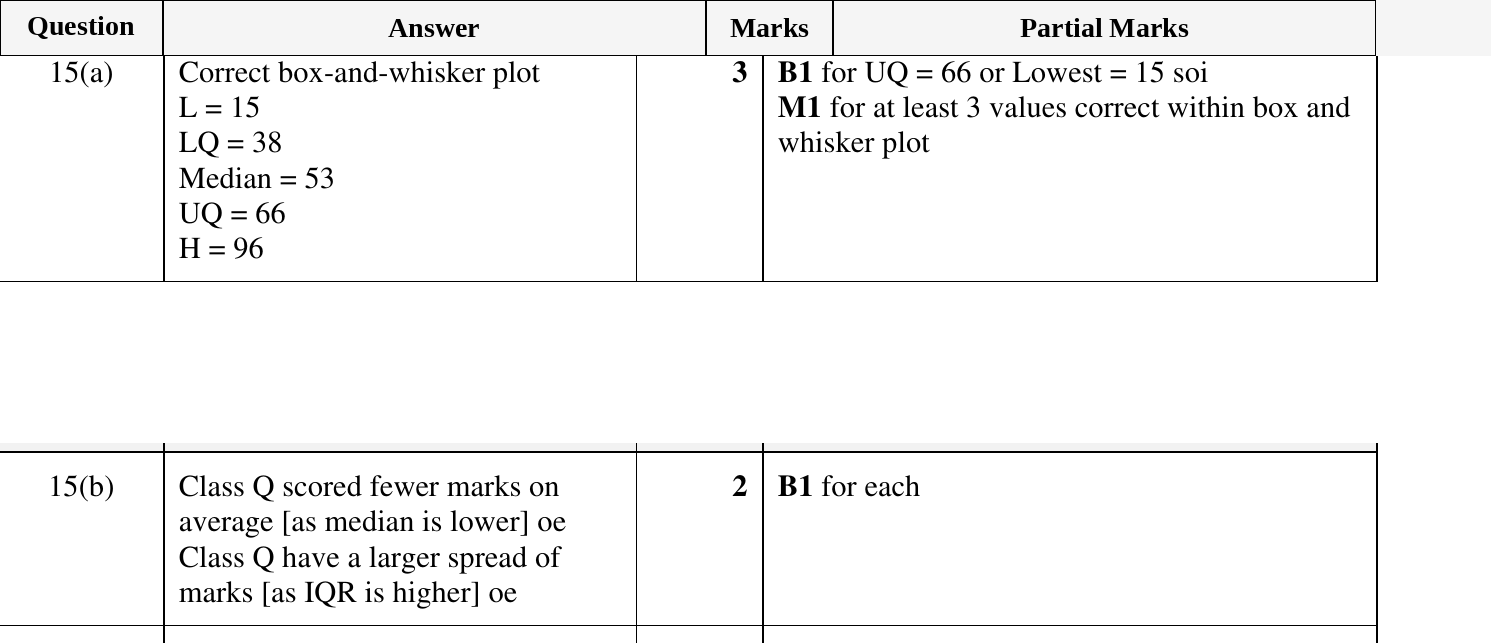
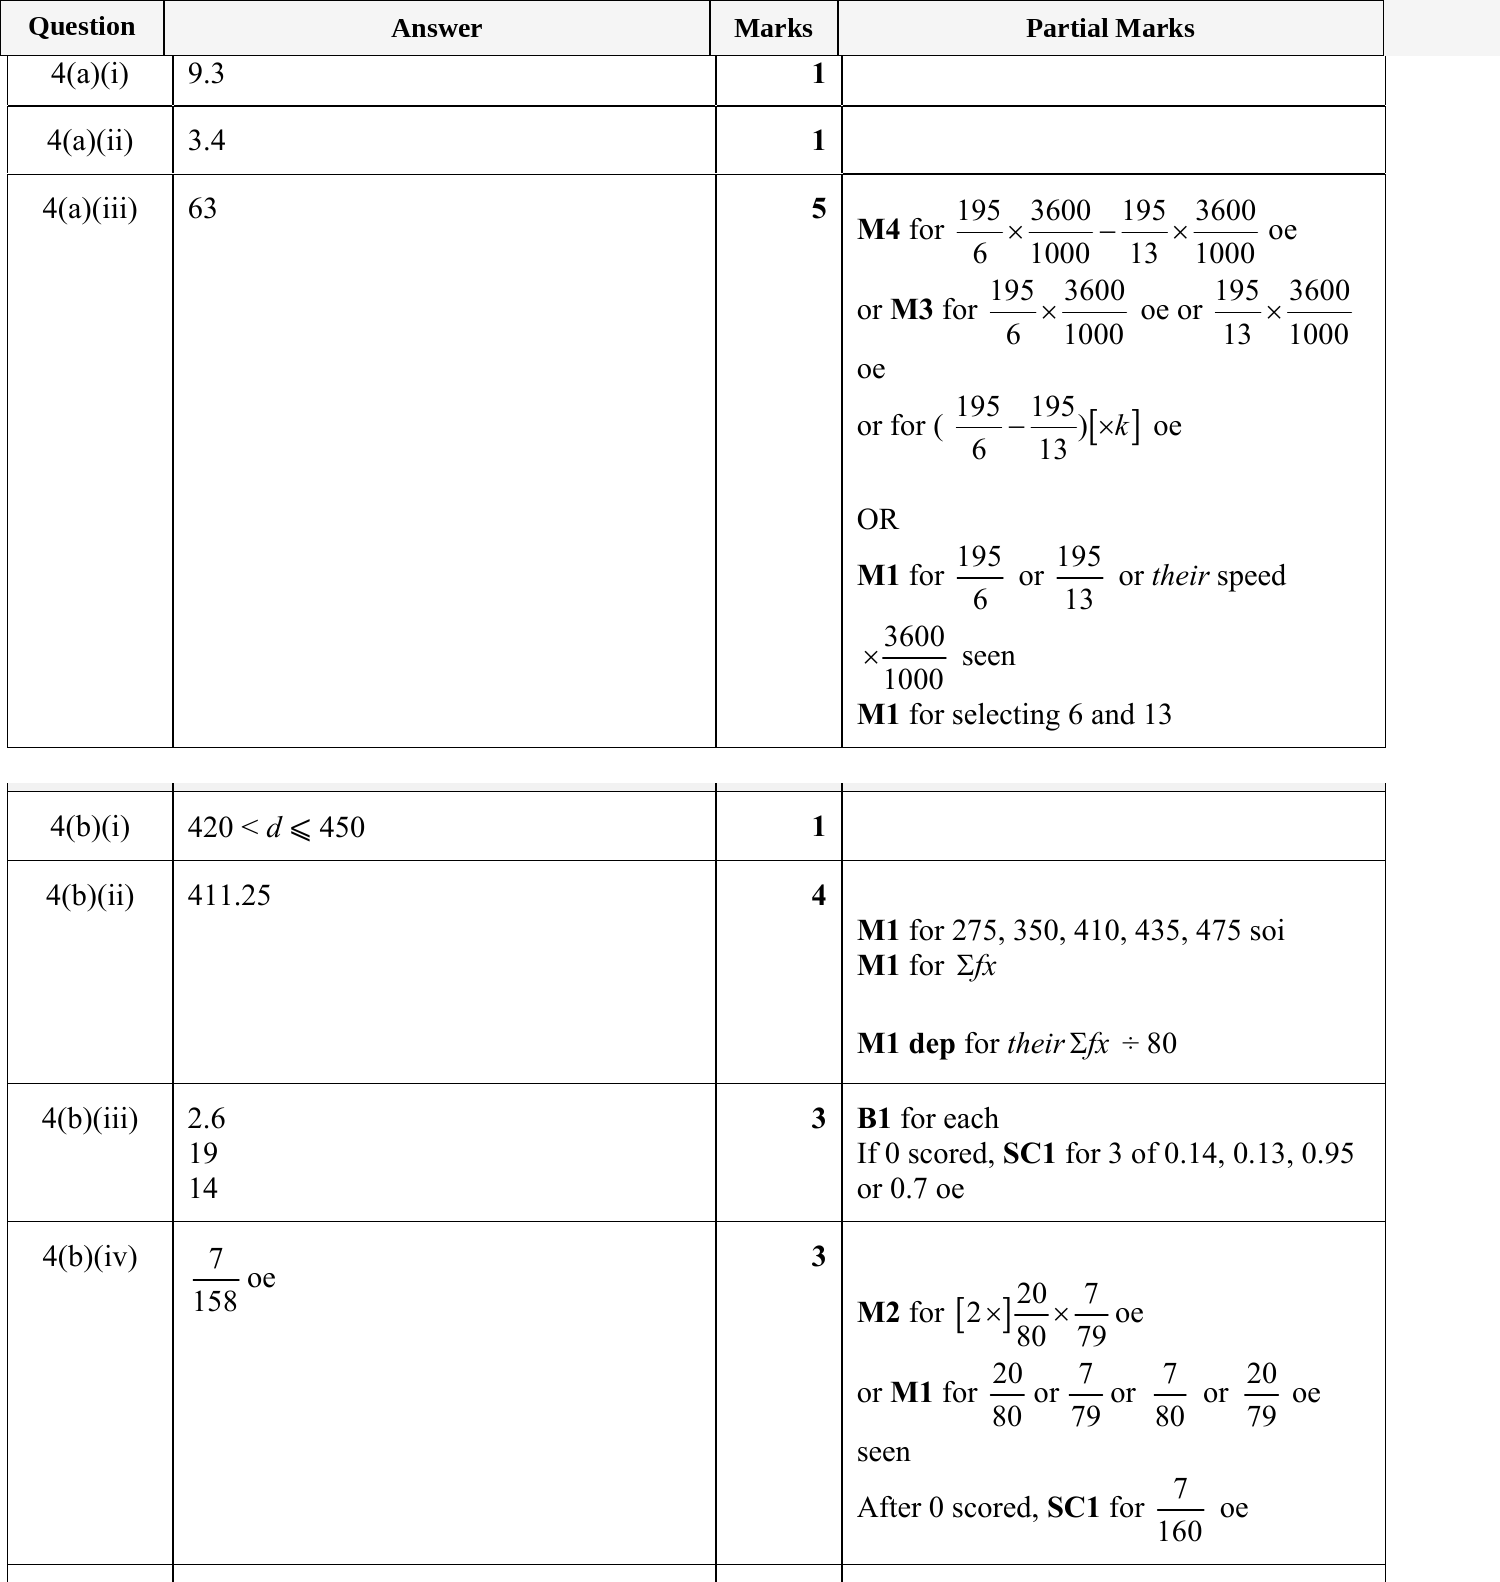
Show mark scheme
Mean = Σfx ÷ Σf (for frequency tables)Range = maximum − minimumInterquartile range (IQR) = Q3 − Q1Median from cumulative frequency: read off at n/2Q1 at n/4; Q3 at 3n/4Frequency density = frequency ÷ class width (for histograms)2 Cambridge IGCSE 0580 questions on box and whisker plots (legacy) at the Extended tier — each with its full mark scheme. For the Core tier on the same skill, click here.
Show the minimum, lower quartile (Q1), median (Q2), upper quartile (Q3), and maximum. Interquartile range (IQR) = Q3 − Q1. The box spans Q1 to Q3; whiskers extend to the extremes.