Question 7 — IGCSE 0580 Oct/Nov 2025 Paper 33
Cambridge IGCSE Mathematics 0580, Core tier, calculator. Topic: Statistics · Statistical graphs. Worth 2 marks.
Open in interactive question bank →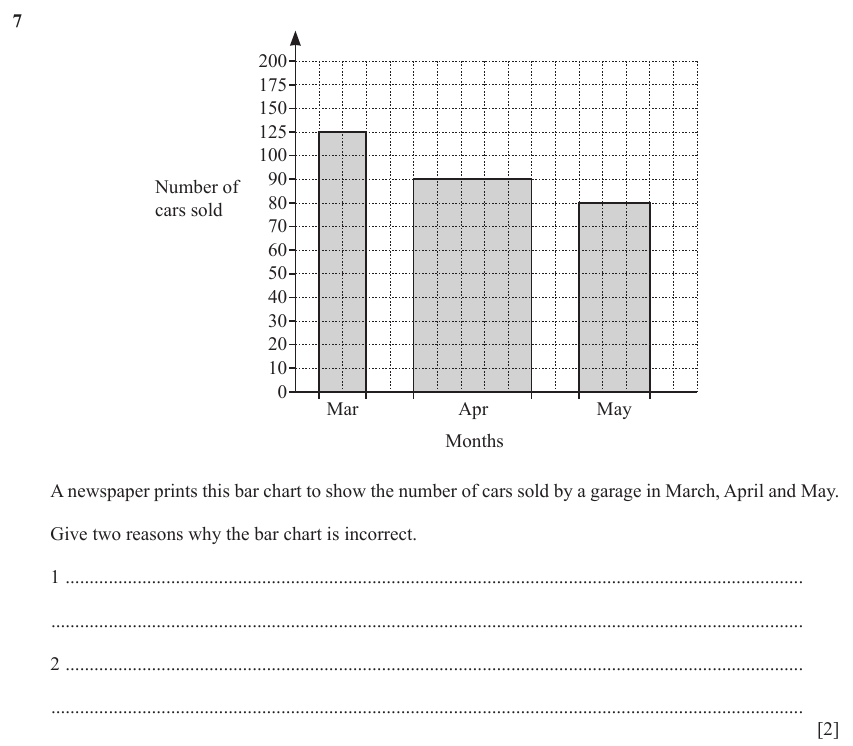
Question text
7
200
175
150
125
100
90
Number of
80
cars sold
70
60
50
40
30
20
10
0
Mar Apr May
Months
A newspaper prints this bar chart to show the number of cars sold by a garage in March, April and May.
Give two reasons why the bar chart is incorrect.
1 ..........................................................................................................................................................
.............................................................................................................................................................
2 ..........................................................................................................................................................
.............................................................................................................................................................
[2]
© UCLES 2025 0580/33/O/N/25 [Turn over
6
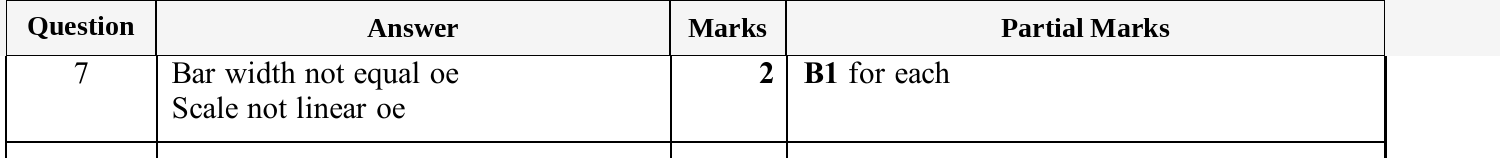
Mark scheme