Question 4 — IGCSE 0580 March 2024 Paper 32
Cambridge IGCSE Mathematics 0580, Core tier, calculator. Topic: Statistics · Statistical graphs. Worth 15 marks.
Open in interactive question bank →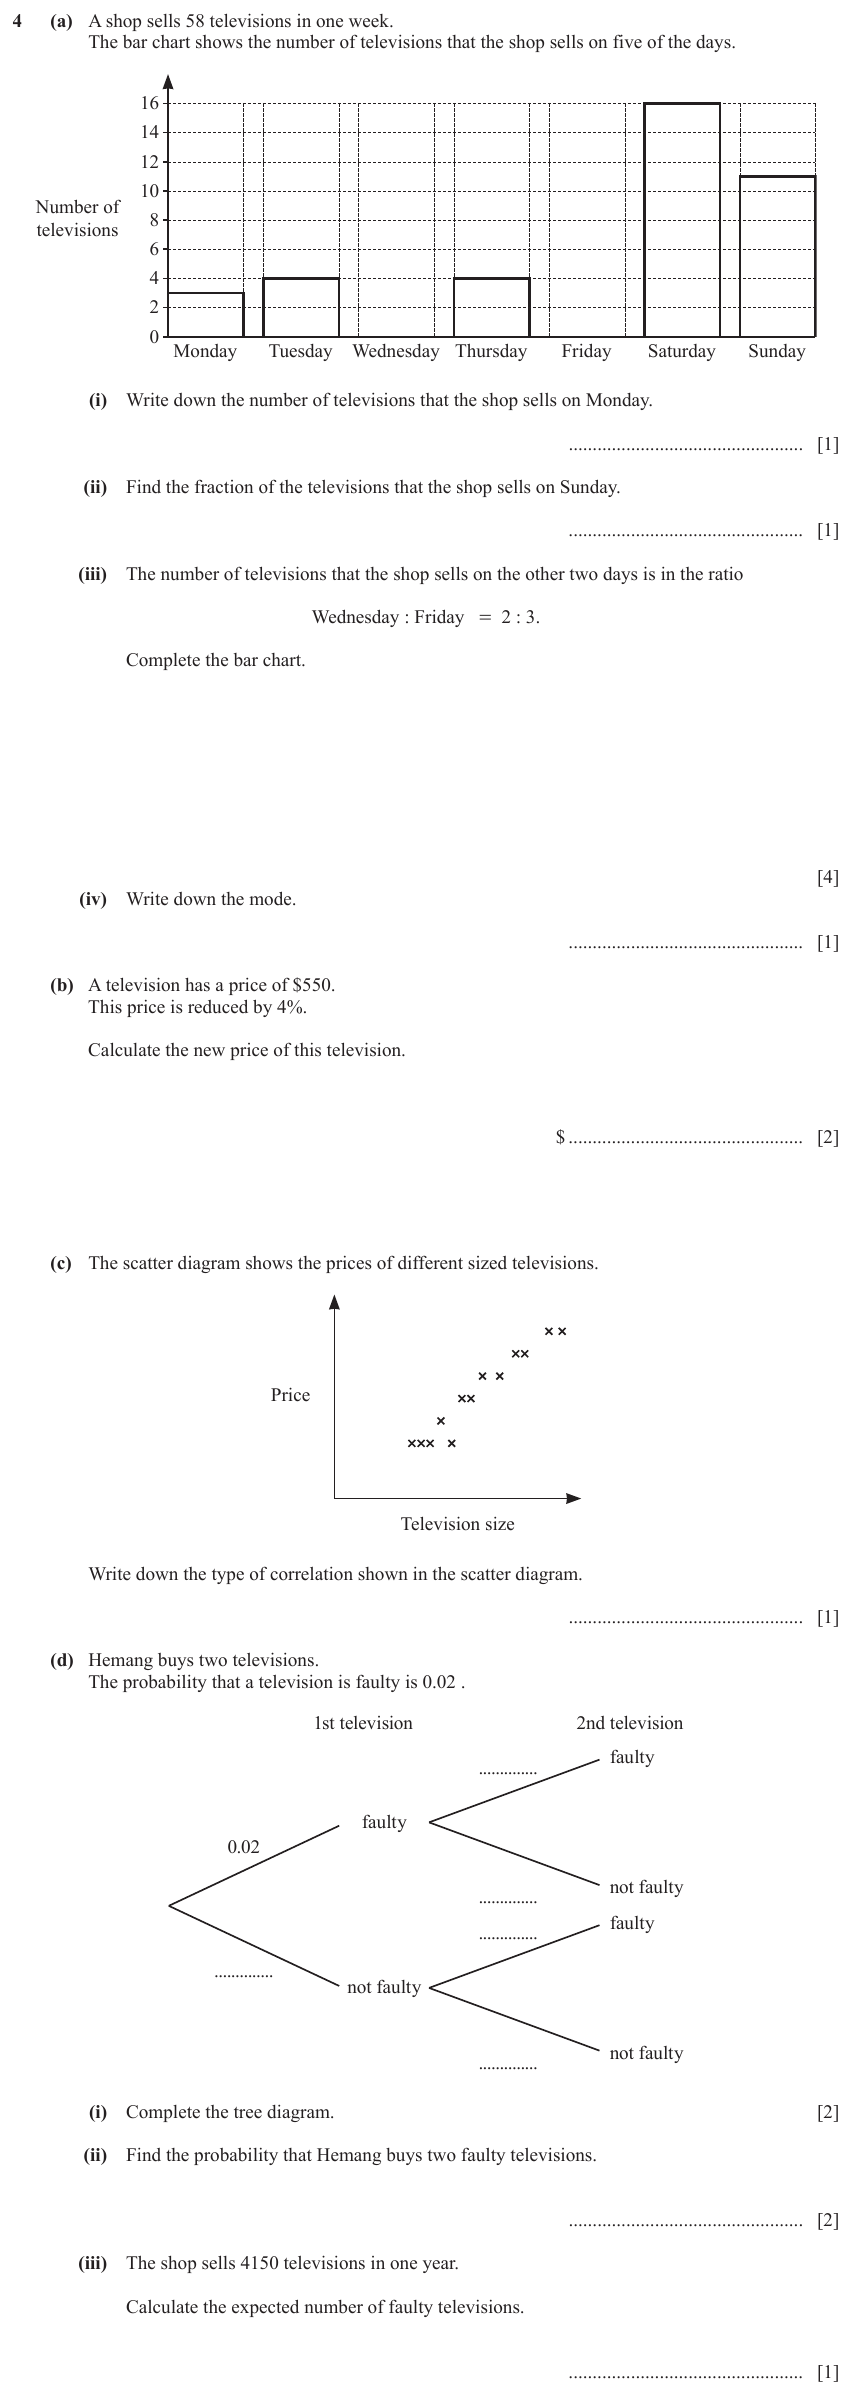
Question text
4 (a) A shop sells 58 televisions in one week.
The bar chart shows the number of televisions that the shop sells on five of the days.
16
14
12
10
Number of
8
televisions
6
4
2
0
Monday Tuesday Wednesday Thursday Friday Saturday Sunday
(i) Write down the number of televisions that the shop sells on Monday.
................................................. [1]
(ii) Find the fraction of the televisions that the shop sells on Sunday.
................................................. [1]
(iii) The number of televisions that the shop sells on the other two days is in the ratio
Wednesday : Friday = 2 : 3.
Complete the bar chart.
[4]
(iv) Write down the mode.
................................................. [1]
(b) A television has a price of $550.
This price is reduced by 4%.
Calculate the new price of this television.
$ ................................................. [2]
© UCLES 2024 0580/32/F/M/24
9
(c) The scatter diagram shows the prices of different sized televisions.
Price
Television size
Write down the type of correlation shown in the scatter diagram.
................................................. [1]
(d) Hemang buys two televisions.
The probability that a television is faulty is 0.02 .
1st television 2nd television
faulty
..............
faulty
0.02
not faulty
..............
faulty
..............
..............
not faulty
not faulty
..............
(i) Complete the tree diagram. [2]
(ii) Find the probability that Hemang buys two faulty televisions.
................................................. [2]
(iii) The shop sells 4150 televisions in one year.
Calculate the expected number of faulty televisions.
................................................. [1]
© UCLES 2024 0580/32/F/M/24 [Turn over
10
2
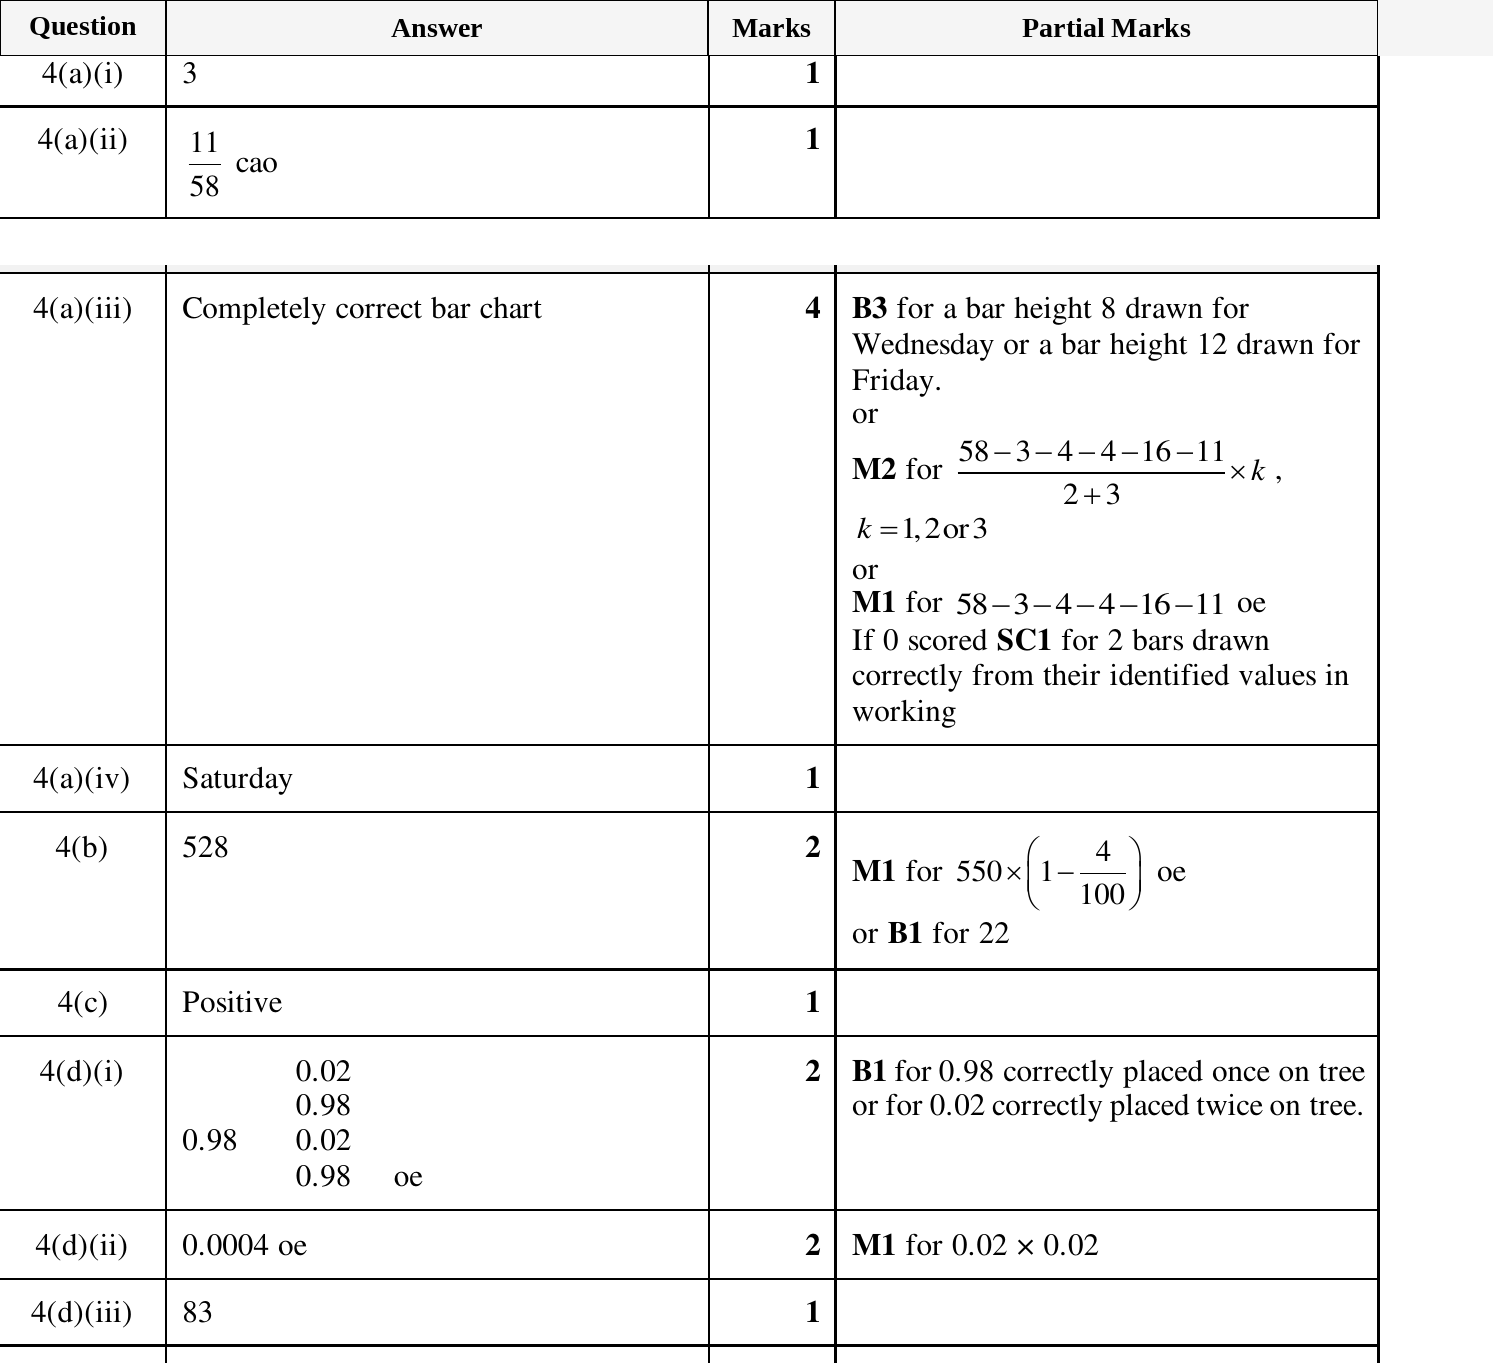
Mark scheme