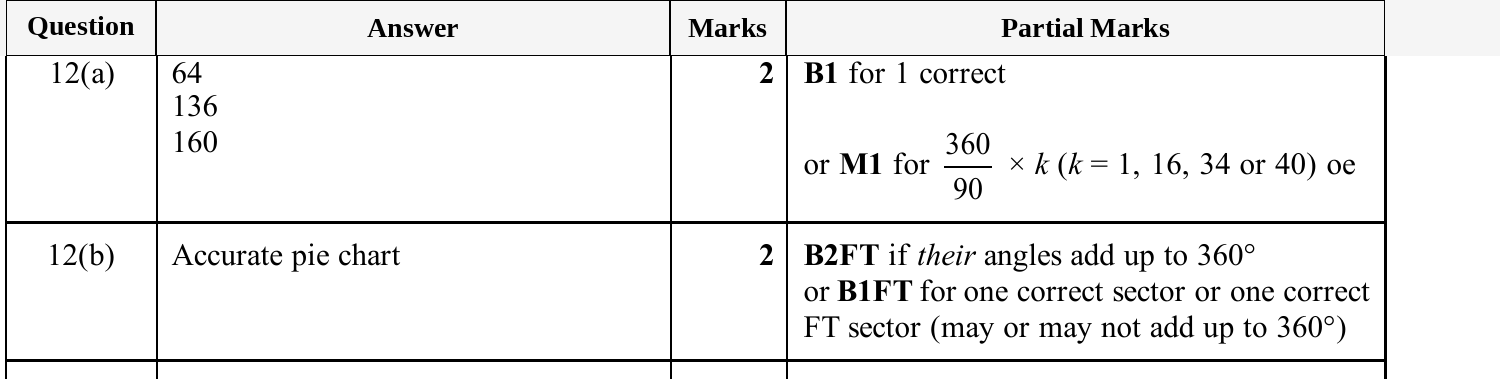
Question 12 — IGCSE 0580 Oct/Nov 2025 Paper 32
Cambridge IGCSE Mathematics 0580, Core tier, calculator. Topic: Statistics · Statistical graphs. Worth 4 marks.
Open in interactive question bank →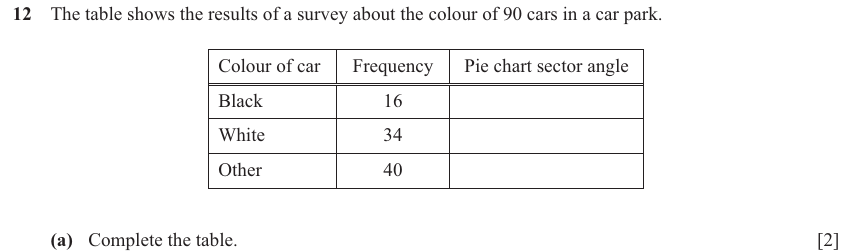
Question text
12 The table shows the results of a survey about the colour of 90 cars in a car park.
Colour of car Frequency Pie chart sector angle
Black 16
White 34
Other 40
(a) Complete the table. [2]
(b) Complete the pie chart.
[2]
(cid:300)(cid:211)(cid:266)(cid:174)(cid:288)(cid:180)(cid:237)(cid:200)(cid:245)(cid:207)(cid:298)(cid:197)(cid:266)(cid:224)(cid:251)(cid:182)(cid:254)(cid:215) [Turn over
© UCLES 2025 (cid:300)(cid:295)(cid:174)(cid:243)(cid:205)(cid:289)(cid:298)(cid:261)(cid:219)(cid:246)(cid:247)(cid:262)(cid:201)(cid:236)(cid:174)(cid:282)(cid:241)(cid:258) 0580/32/O/N/25
(cid:293)(cid:261)(cid:181)(cid:277)(cid:245)(cid:213)(cid:261)(cid:213)(cid:245)(cid:261)(cid:197)(cid:197)(cid:197)(cid:245)(cid:261)(cid:181)(cid:261)(cid:213)
M
SIHT
NI
ETIRW
TON
OD
NIGRAM
SIHT
NI
ETIRW
TON
OD
NIGRAM
SIHT
NI
ETIRW
TON
OD
NIGRAM
SIHT
NI
ETIRW
TON
OD
NIGRAM
SIHT
NI
ETIRW
TON
OD
* 0000800000008 *
8
(cid:44)(cid:1)(cid:1)(cid:1)(cid:1)(cid:9)(cid:1)(cid:1)(cid:1)(cid:1)(cid:1)(cid:1)(cid:1)(cid:9)(cid:44)
NIGRAM
DFD
Mark scheme