Question 5 — IGCSE 0580 Oct/Nov 2025 Paper 22
Cambridge IGCSE Mathematics 0580, Extended tier, non-calculator. Topic: Statistics · Statistical graphs. Worth 5 marks.
Open in interactive question bank →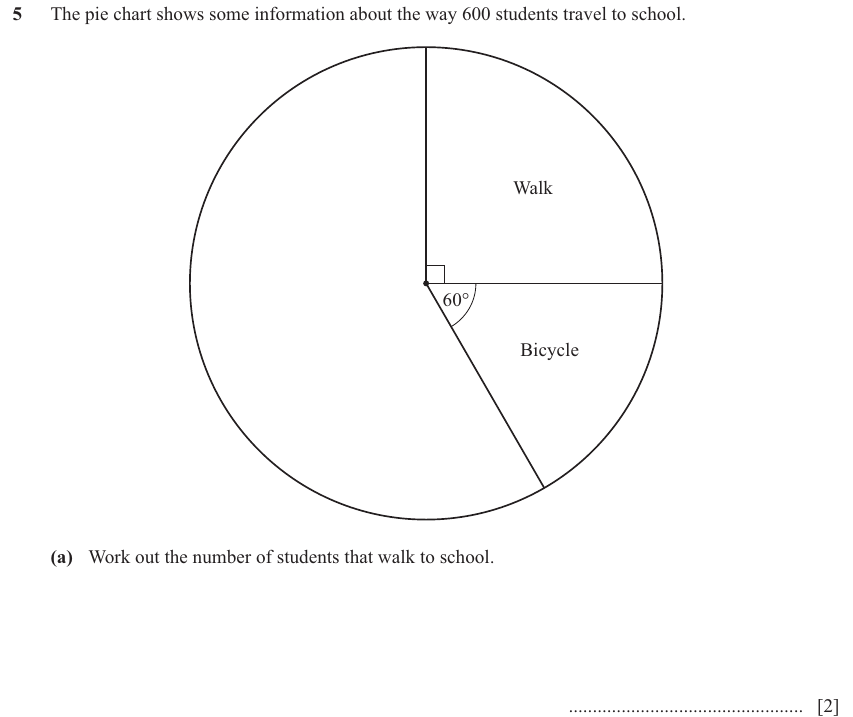
Question text
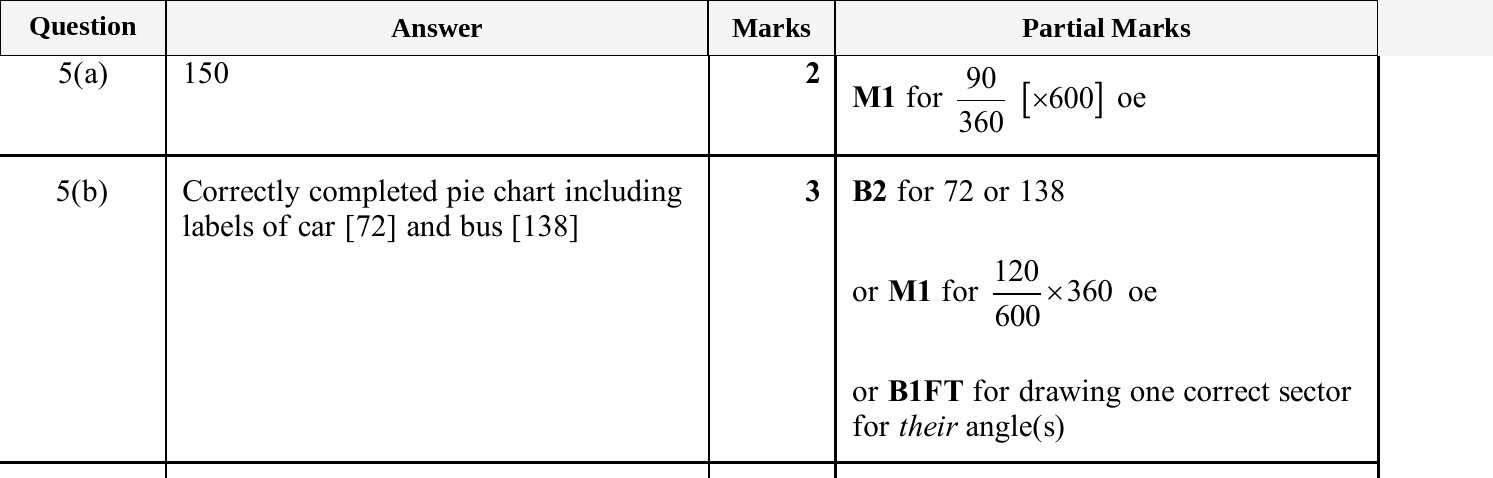
5 The pie chart shows some information about the way 600 students travel to school.
Walk
60°
Bicycle
(a) Work out the number of students that walk to school.
................................................. [2]
(b) 120 of the students travel to school by car.
The remaining students travel by bus.
Complete the pie chart.
[3]
(cid:300)(cid:205)(cid:266)(cid:174)(cid:288)(cid:180)(cid:237)(cid:200)(cid:245)(cid:207)(cid:298)(cid:197)(cid:266)(cid:223)(cid:250)(cid:184)(cid:256)(cid:215)
© UCLES 2025 (cid:300)(cid:260)(cid:175)(cid:251)(cid:209)(cid:296)(cid:252)(cid:299)(cid:212)(cid:266)(cid:251)(cid:286)(cid:228)(cid:191)(cid:260)(cid:218)(cid:249)(cid:258) 0580/22/O/N/25
(cid:293)(cid:181)(cid:261)(cid:213)(cid:245)(cid:213)(cid:197)(cid:277)(cid:181)(cid:197)(cid:197)(cid:261)(cid:261)(cid:213)(cid:229)(cid:277)(cid:261)(cid:213)
M
SIHT
NI
ETIRW
TON
OD
NIGRAM
SIHT
NI
ETIRW
TON
OD
NIGRAM
SIHT
NI
ETIRW
TON
OD
NIGRAM
SIHT
NI
ETIRW
TON
OD
NIGRAM
SIHT
NI
ETIRW
TON
OD
* 0000800000005 *
5
(cid:44)(cid:1)(cid:1)(cid:1)(cid:1)(cid:9)(cid:1)(cid:1)(cid:1)(cid:1)(cid:1)(cid:1)(cid:1)(cid:6)(cid:44)
NIGRAM
DFD
Mark scheme