Question 10 — IGCSE 0580 Oct/Nov 2025 Paper 11
Cambridge IGCSE Mathematics 0580, Core tier, non-calculator. Topic: Statistics · Statistical graphs. Worth 3 marks.
Open in interactive question bank →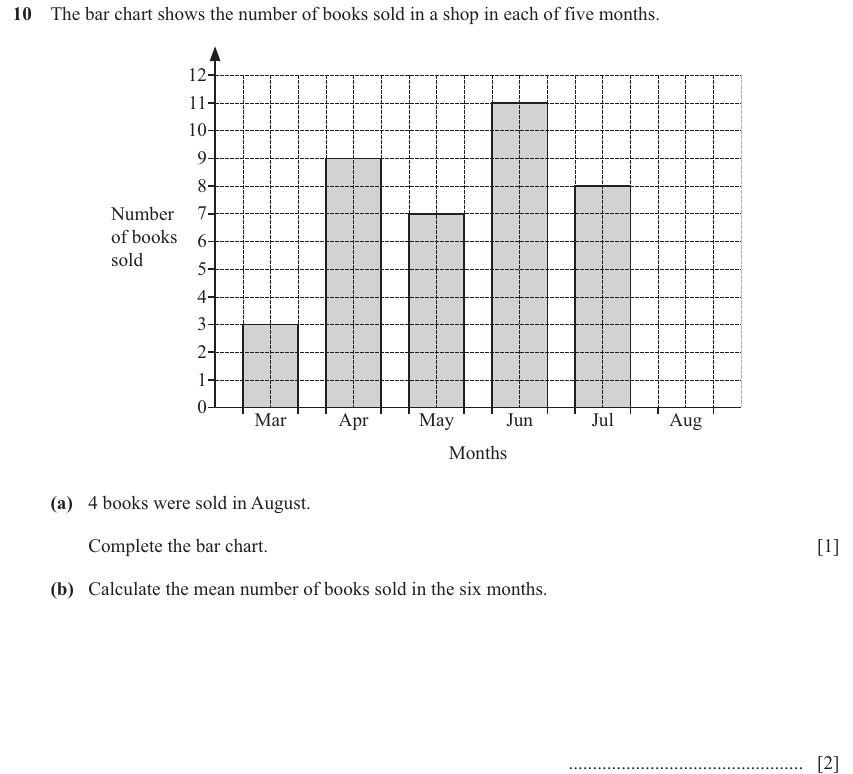
Question text
10 The bar chart shows the number of books sold in a shop in each of five months.
12
11
10
9
8
Number 7
of books 6
sold
5
4
3
2
1
0
Mar Apr May Jun Jul Aug
Months
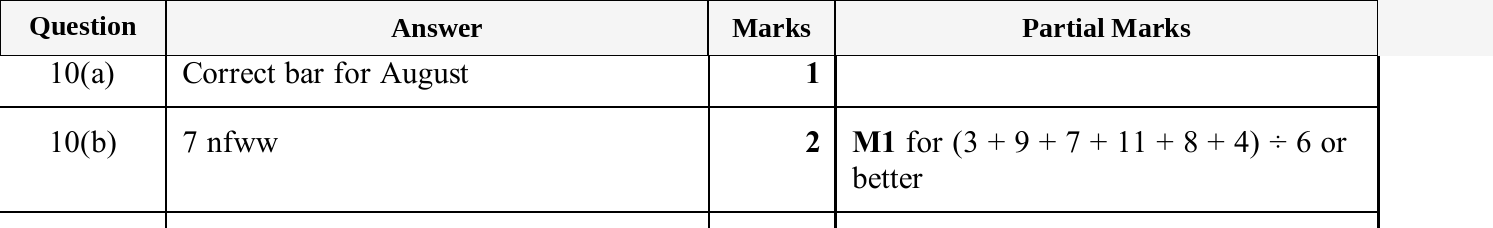
(a) 4 books were sold in August.
Complete the bar chart. [1]
(b) Calculate the mean number of books sold in the six months.
................................................. [2]
M
SIHT
NI
ETIRW
TON
OD
NIGRAM
SIHT
NI
ETIRW
TON
OD
NIGRAM
SIHT
NI
ETIRW
TON
OD
NIGRA
Mark scheme