Question 8 — IGCSE 0580 Oct/Nov 2024 Paper 43
Cambridge IGCSE Mathematics 0580, Extended tier, calculator. Topic: Statistics · Statistical graphs. Worth 9 marks.
Open in interactive question bank →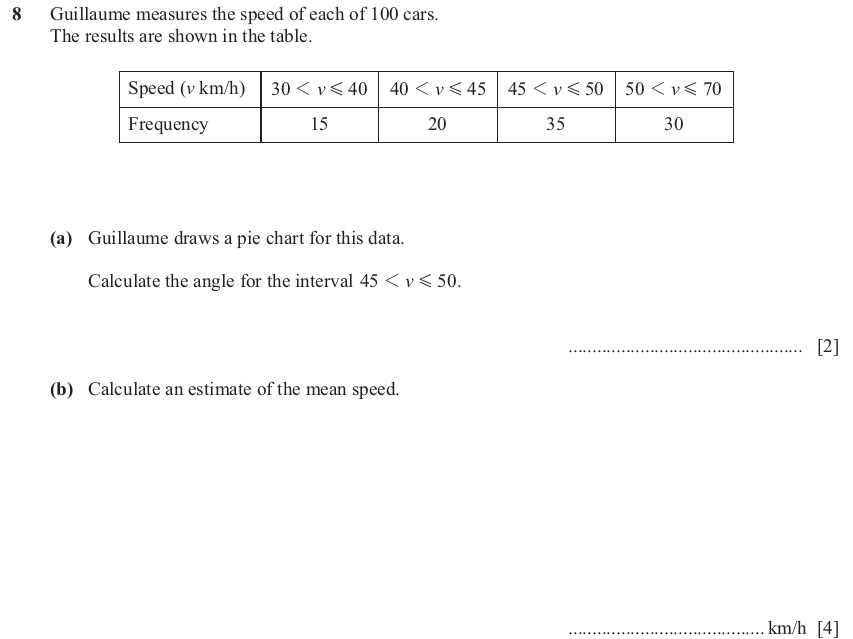
Question text
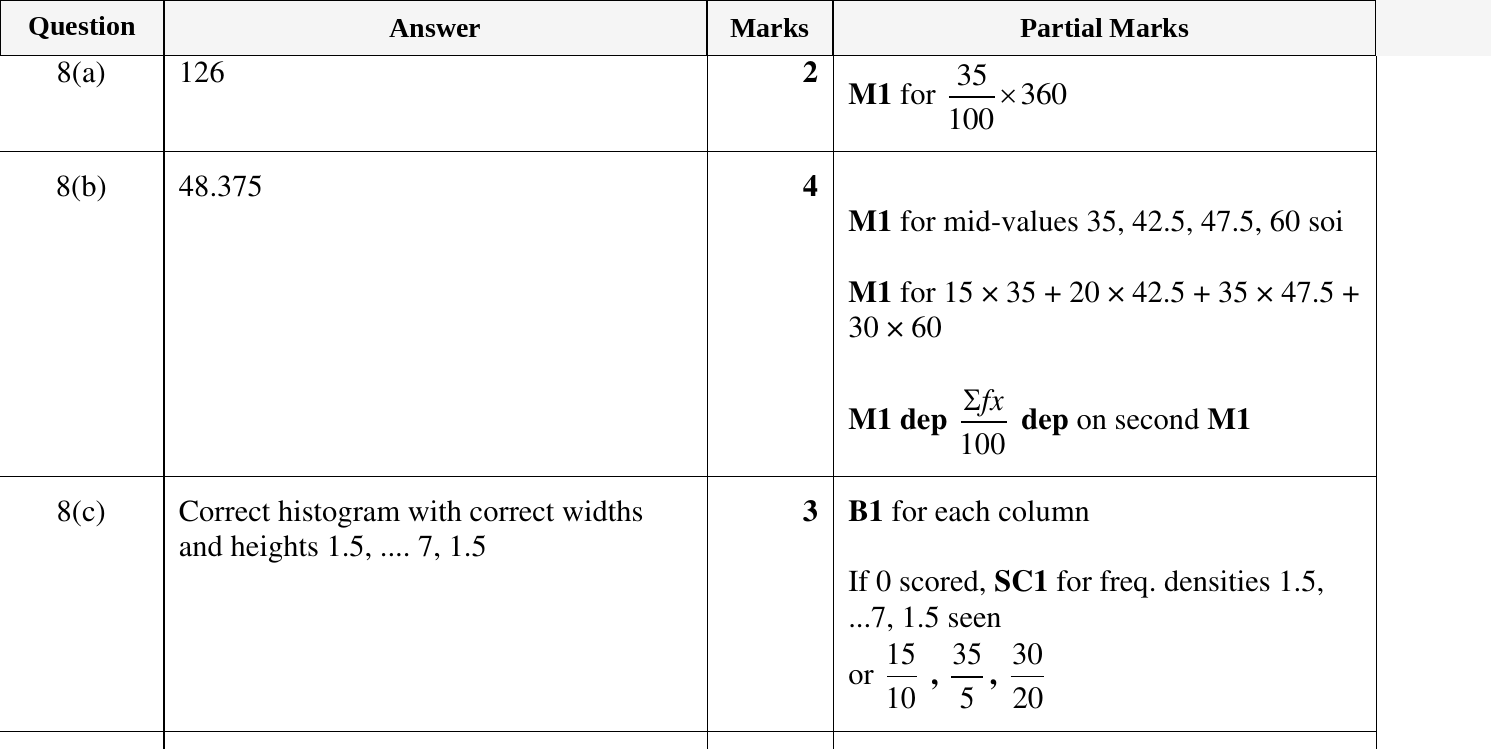
8 Guillaume measures the speed of each of 100 cars.
The results are shown in the table.
Speed (v km/h) 30 1 v G 40 40 1 v G 45 45 1 v G 50 50 1 v G 70
Frequency 15 20 35 30
(a) Guillaume draws a pie chart for this data.
Calculate the angle for the interval 45 1 v G 50.
................................................. [2]
(b) Calculate an estimate of the mean speed.
......................................... km/h [4]
(c) Complete the histogram to show the data in the table.
8
7
6
5
Frequency
density 4
3
2
1
0
30 40 50 60 70 v
Speed (km / h)
[3]
(cid:300)(cid:217)(cid:266)(cid:174)(cid:288)(cid:180)(cid:237)(cid:200)(cid:245)(cid:207)(cid:298)(cid:197)(cid:266)(cid:222)(cid:252)(cid:183)(cid:256)(cid:215)
© UCLES 2024 (cid:300)(cid:226)(cid:229)(cid:252)(cid:205)(cid:295)(cid:291)(cid:300)(cid:235)(cid:246)(cid:245)(cid:263)(cid:276)(cid:217)(cid:279)(cid:209)(cid:297)(cid:258) 0580/43/O/N/24
(cid:293)(cid:197)(cid:197)(cid:277)(cid:181)(cid:213)(cid:261)(cid:277)(cid:293)(cid:277)(cid:277)(cid:197)(cid:197)(cid:245)(cid:229)(cid:213)(cid:229)(cid:213)
M
SIHT
NI
ETIRW
TON
OD
NIGRAM
SIHT
NI
ETIRW
TON
OD
NIGRAM
SIHT
NI
ETIRW
TON
OD
NIGRAM
SIHT
NI
ETIRW
TON
OD
NIGRAM
SIHT
NI
ETIRW
TON
OD
* 0000800000013 *
13
(cid:44)(cid:1)(cid:1)(cid:1)(cid:1)(cid:9)(cid:1)(cid:1)(cid:1)(cid:1)(cid:1)(cid:1)(cid:2)(cid:4)(cid:44)
NIGRAM
Mark scheme