Question 2 — IGCSE 0580 Oct/Nov 2023 Paper 43
Cambridge IGCSE Mathematics 0580, Extended tier, calculator. Topic: Statistics · Statistical graphs. Worth 11 marks.
Open in interactive question bank →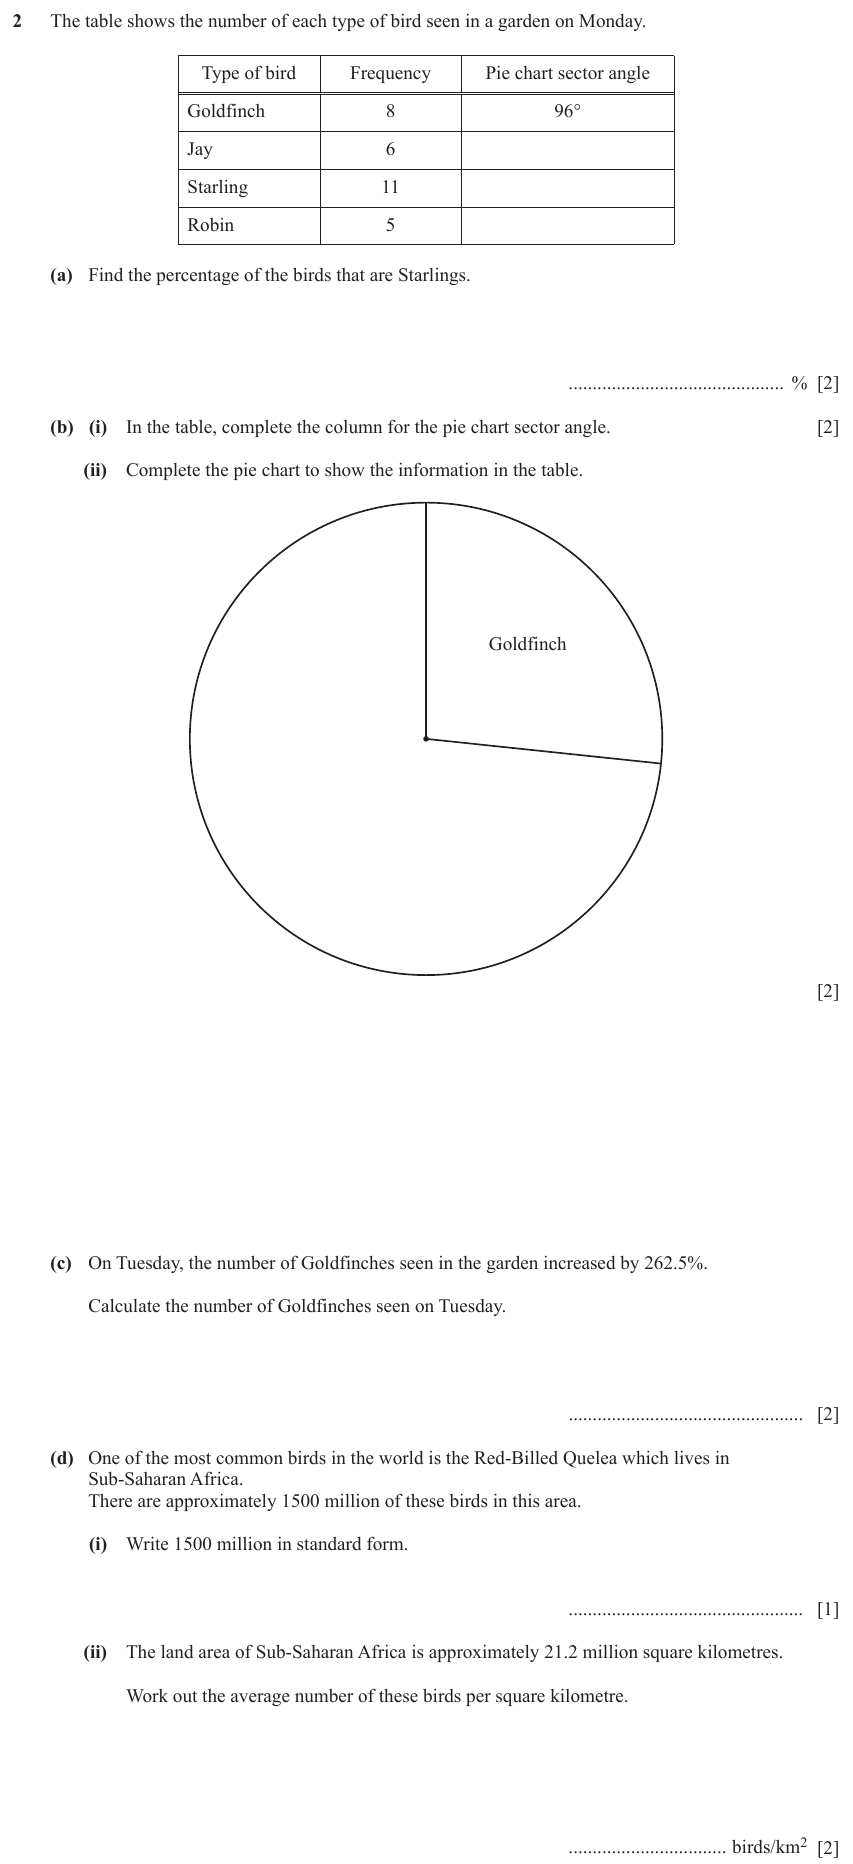
Question text
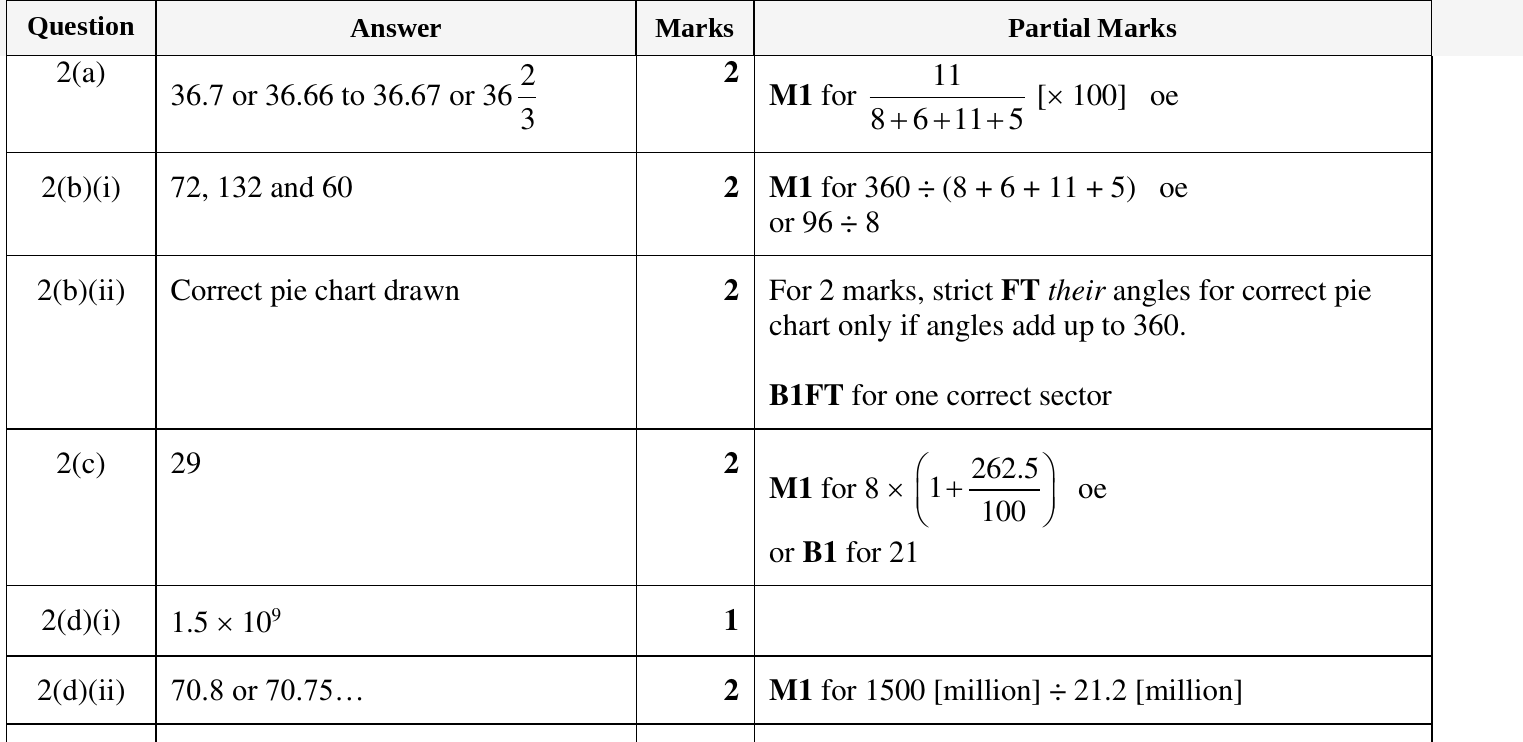
2 The table shows the number of each type of bird seen in a garden on Monday.
Type of bird Frequency Pie chart sector angle
Goldfinch 8 96°
Jay 6
Starling 11
Robin 5
(a) Find the percentage of the birds that are Starlings.
............................................. % [2]
(b) (i) In the table, complete the column for the pie chart sector angle. [2]
(ii) Complete the pie chart to show the information in the table.
Goldfinch
[2]
© UCLES 2023 0580/43/O/N/23
5
(c) On Tuesday, the number of Goldfinches seen in the garden increased by 262.5%.
Calculate the number of Goldfinches seen on Tuesday.
................................................. [2]
(d) One of the most common birds in the world is the Red-Billed Quelea which lives in
Sub-Saharan Africa.
There are approximately 1500 million of these birds in this area.
(i) Write 1500 million in standard form.
................................................. [1]
(ii) The land area of Sub-Saharan Africa is approximately 21.2 million square kilometres.
Work out the average number of these birds per square kilometre.
................................. birds/km2 [2]
© UCLES 2023 0580/43/O/N/23 [Turn over
6
Mark scheme