Question 3 — IGCSE 0580 Oct/Nov 2023 Paper 31
Cambridge IGCSE Mathematics 0580, Core tier, calculator. Topic: Statistics · Statistical graphs. Worth 11 marks.
Open in interactive question bank →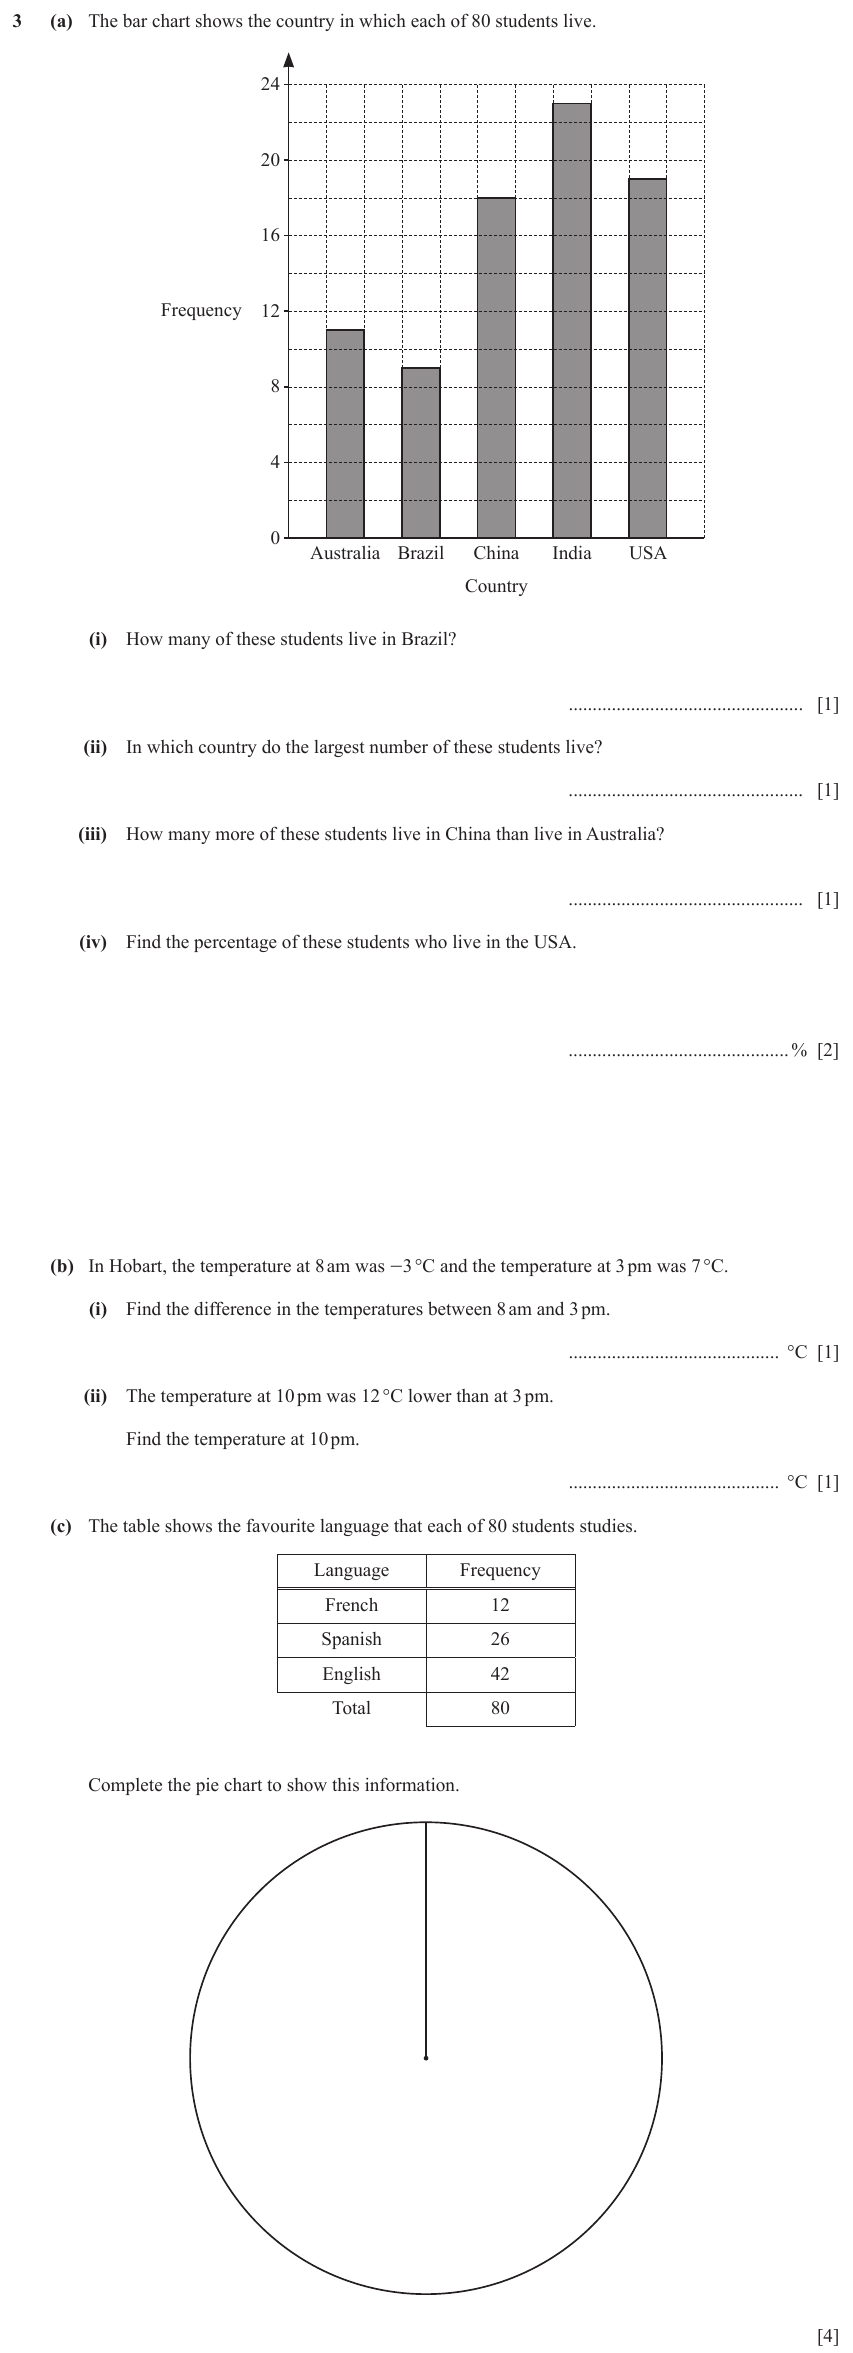
Question text
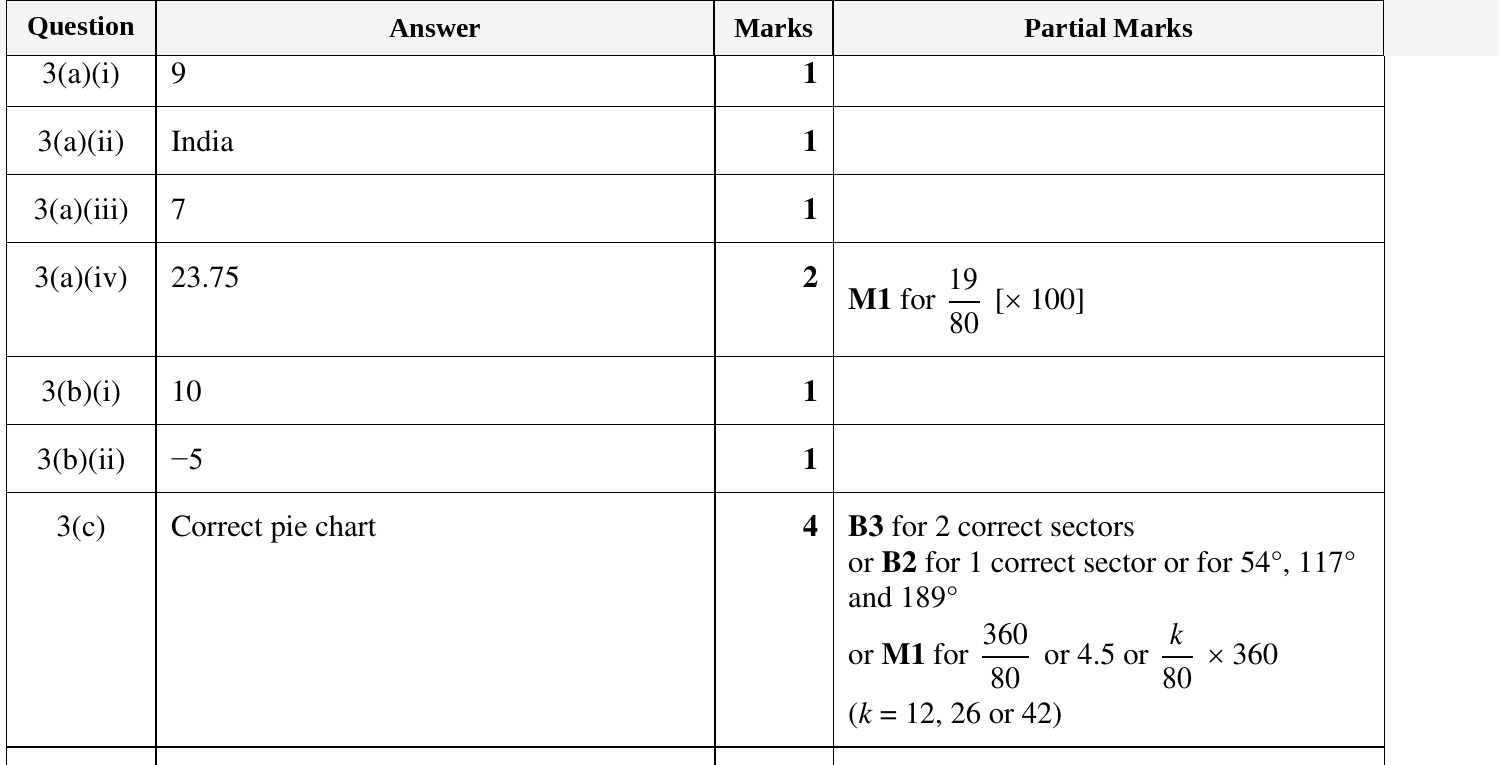
3 (a) The bar chart shows the country in which each of 80 students live.
24
20
16
Frequency 12
8
4
0
Australia Brazil China India USA
Country
(i) How many of these students live in Brazil?
................................................. [1]
(ii) In which country do the largest number of these students live?
................................................. [1]
(iii) How many more of these students live in China than live in Australia?
................................................. [1]
(iv) Find the percentage of these students who live in the USA.
..............................................% [2]
© UCLES 2023 0580/31/O/N/23
7
(b) In Hobart, the temperature at 8 am was -3 °C and the temperature at 3 pm was 7 °C.
(i) Find the difference in the temperatures between 8 am and 3 pm.
............................................ °C [1]
(ii) The temperature at 10 pm was 12 °C lower than at 3 pm.
Find the temperature at 10 pm.
............................................ °C [1]
(c) The table shows the favourite language that each of 80 students studies.
Language Frequency
French 12
Spanish 26
English 42
Total 80
Complete the pie chart to show this information.
[4]
© UCLES 2023 0580/31/O/N/23 [Turn over
8
Mark scheme