Question 13 — IGCSE 0580 May/June 2025 Paper 22
Cambridge IGCSE Mathematics 0580, Extended tier, non-calculator. Topic: Statistics · Frequency density. Worth 11 marks.
Open in interactive question bank →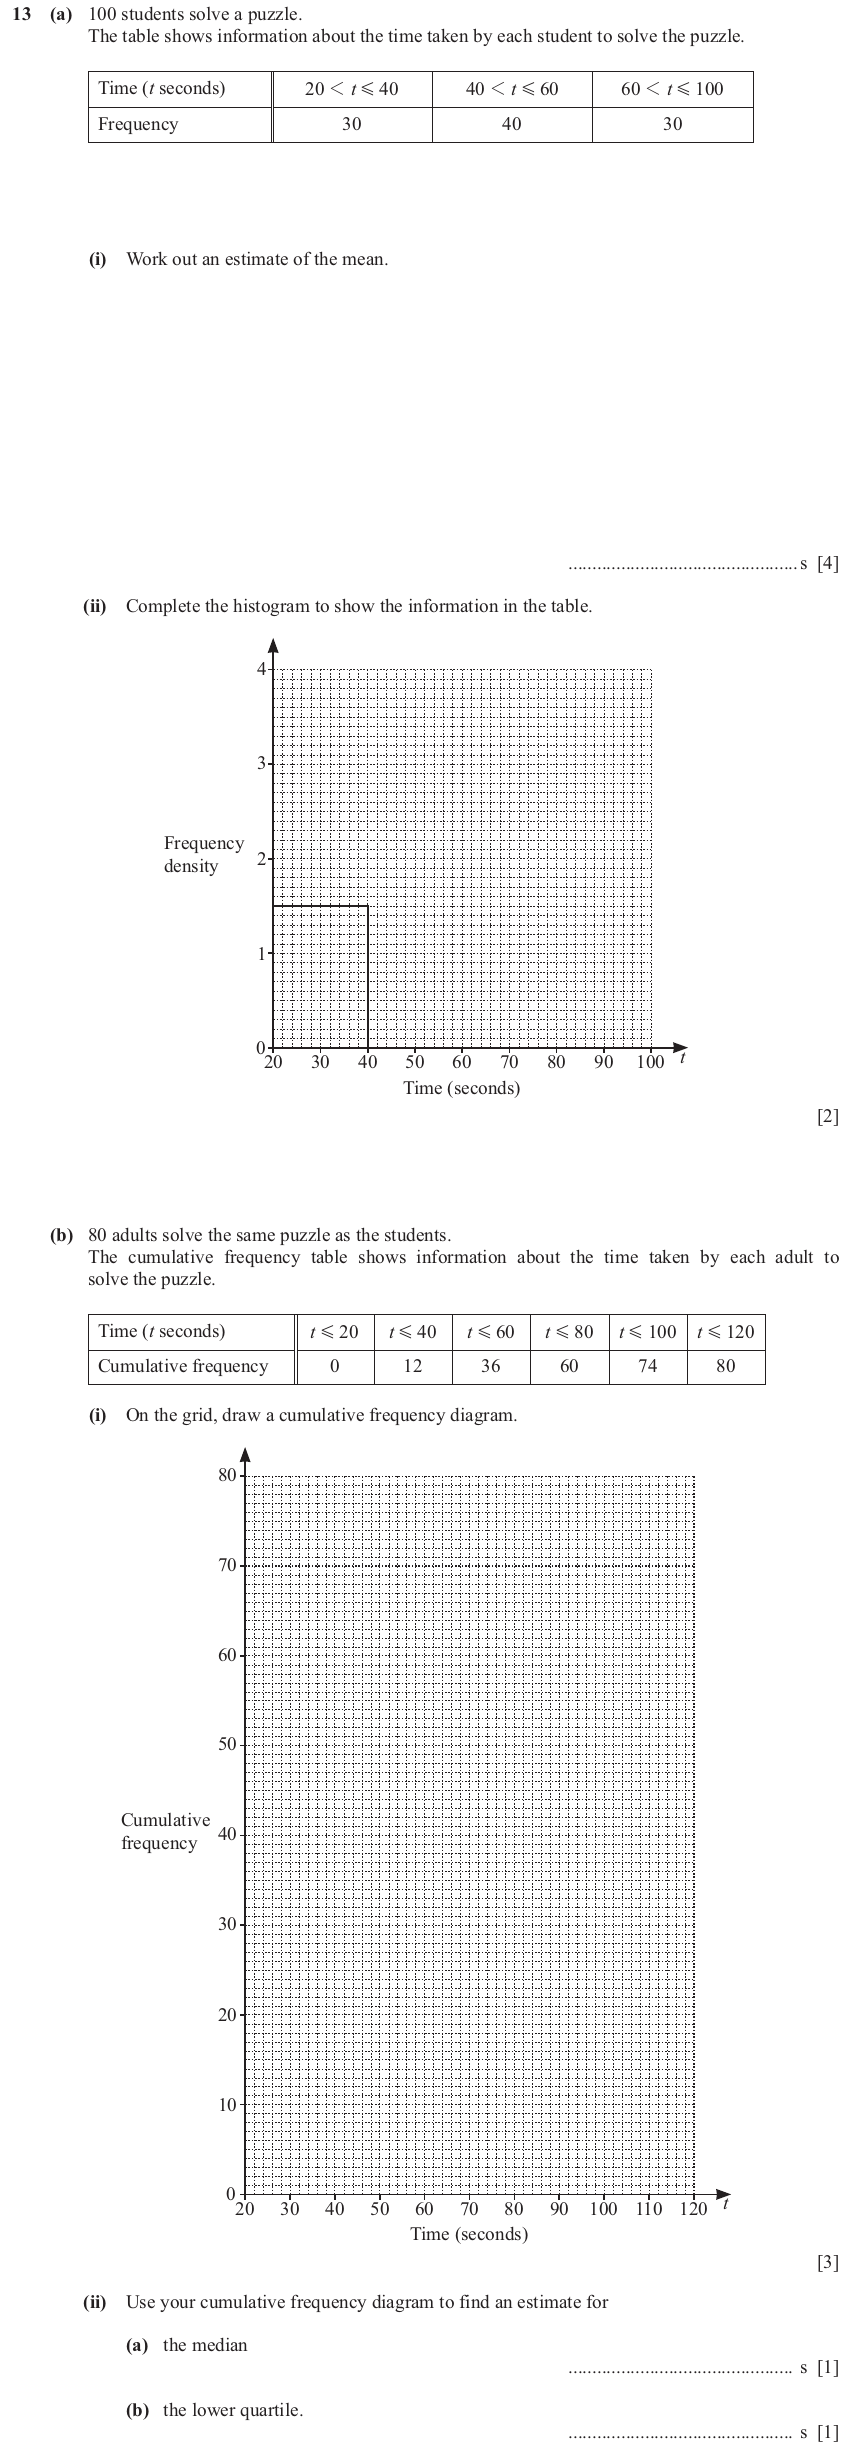
Question text
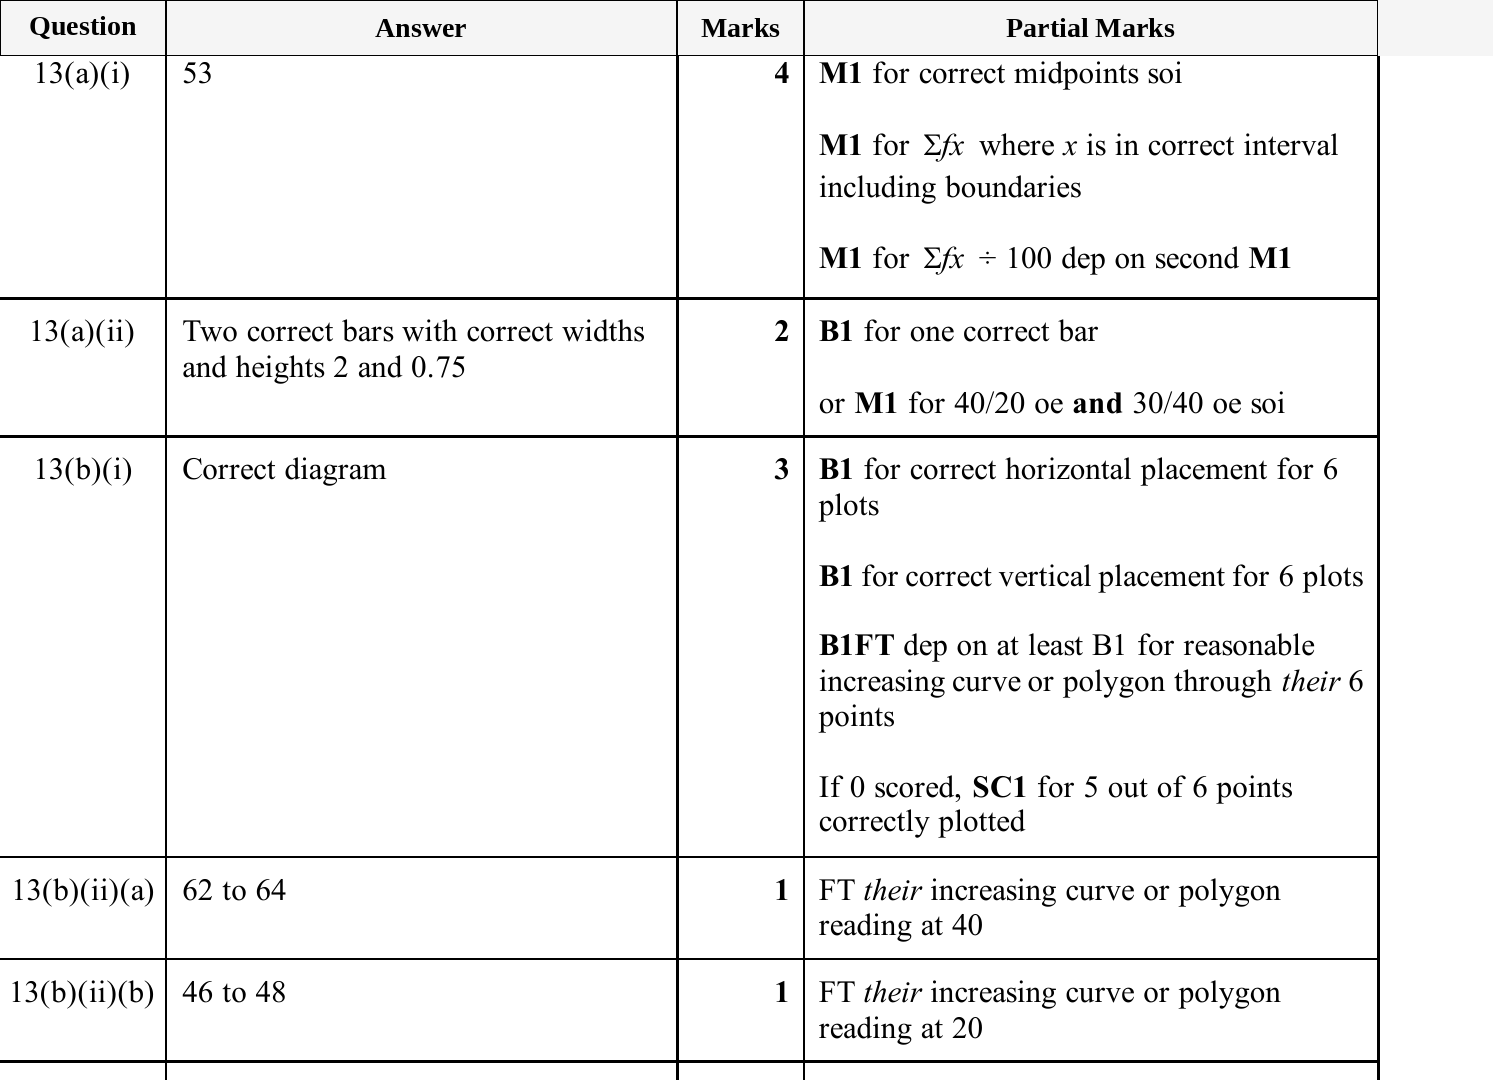
13 (a) 100 students solve a puzzle.
The table shows information about the time taken by each student to solve the puzzle.
Time (t seconds) 20 1 t G 40 40 1 t G 60 60 1 t G 100
Frequency 30 40 30
(i) Work out an estimate of the mean.
................................................s [4]
(ii) Complete the histogram to show the information in the table.
4
3
Frequency
2
density
1
0
t 20 30 40 50 60 70 80 90 100
Time (seconds)
[2]
(cid:300)(cid:217)(cid:266)(cid:174)(cid:288)(cid:180)(cid:237)(cid:200)(cid:245)(cid:207)(cid:298)(cid:197)(cid:266)(cid:224)(cid:250)(cid:183)(cid:254)(cid:215)
© UCLES 2025 (cid:300)(cid:226)(cid:269)(cid:251)(cid:214)(cid:298)(cid:253)(cid:272)(cid:230)(cid:256)(cid:251)(cid:266)(cid:208)(cid:194)(cid:288)(cid:226)(cid:259)(cid:258) 0580/22/M/J/25
(cid:293)(cid:245)(cid:261)(cid:213)(cid:245)(cid:213)(cid:261)(cid:277)(cid:213)(cid:213)(cid:293)(cid:197)(cid:197)(cid:181)(cid:293)(cid:245)(cid:245)(cid:213)
M
SIHT
NI
ETIRW
TON
OD
NIGRAM
SIHT
NI
ETIRW
TON
OD
NIGRAM
SIHT
NI
ETIRW
TON
OD
NIGRAM
SIHT
NI
ETIRW
TON
OD
NIGRAM
SIHT
NI
ETIRW
TON
OD
* 0000800000011 *
11
(cid:44)(cid:1)(cid:1)(cid:1)(cid:1)(cid:9)(cid:1)(cid:1)(cid:1)(cid:1)(cid:1)(cid:1)(cid:2)(cid:2)(cid:44)
(b) 80 adults solve the same puzzle as the students.
The cumulative frequency table shows information about the time taken by each adult to
solve the puzzle.
Time (t seconds) t G 20 t G 40 t G 60 t G 80 t G 100 t G 120
Cumulative frequency 0 12 36 60 74 80
(i) On the grid, draw a cumulative frequency diagram.
80
70
60
50
Cumulative
40
frequency
30
20
10
0
t
20 30 40 50 60 70 80 90 100 110 120
Time (seconds)
[3]
(ii) Use your cumulative frequency diagram to find an estimate for
(a) the median
............................................... s [1]
(b) the lower quartile.
............................................... s [1]
(cid:300)(cid:219)(cid:266)(cid:174)(cid:288)(cid:180)(cid:237)(cid:200)(cid:245)(cid:207)(cid:298)(cid:197)(cid:266)(cid:224)(cid:252)(cid:183)(cid:254)(cid:215) [Turn over
© UCLES 2025 (cid:300)(cid:226)(cid:270)(cid:252)(cid:206)(cid:288)(cid:257)(cid:288)(cid:211)(cid:250)(cid:262)(cid:191)(cid:268)(cid:186)(cid:188)(cid:226)(cid:243)(cid:258) 0580/22/M/J/25
(cid:293)(cid:245)(cid:245)(cid:277)(cid:181)(cid:181)(cid:293)(cid:245)(cid:197)(cid:229)(cid:181)(cid:197)(cid:197)(cid:213)(cid:261)(cid:181)(cid:293)(cid:213)
NIGRAM
SIHT
NI
ETIRW
TON
OD
NIGRAM
SIHT
NI
ETIRW
TON
OD
NIGRAM
SIHT
NI
ETIRW
TON
OD
NIGRAM
SIHT
NI
ETIRW
TON
OD
NIGRAM
SIHT
NI
ETIRW
TON
OD
DFD
* 0000800000012 *
12
(cid:44)(cid:1)(cid:1)(cid:1)(cid:1)(cid:9)(cid:1)(cid:1)(cid:1)(cid:1)(cid:1)(cid:1)(cid:2)(cid:3)(cid:44)
o
NIGRAM
DFD
Mark scheme