Question 3 — IGCSE 0580 May/June 2024 Paper 42
Cambridge IGCSE Mathematics 0580, Extended tier, calculator. Topic: Statistics · Frequency density. Worth 15 marks.
Open in interactive question bank →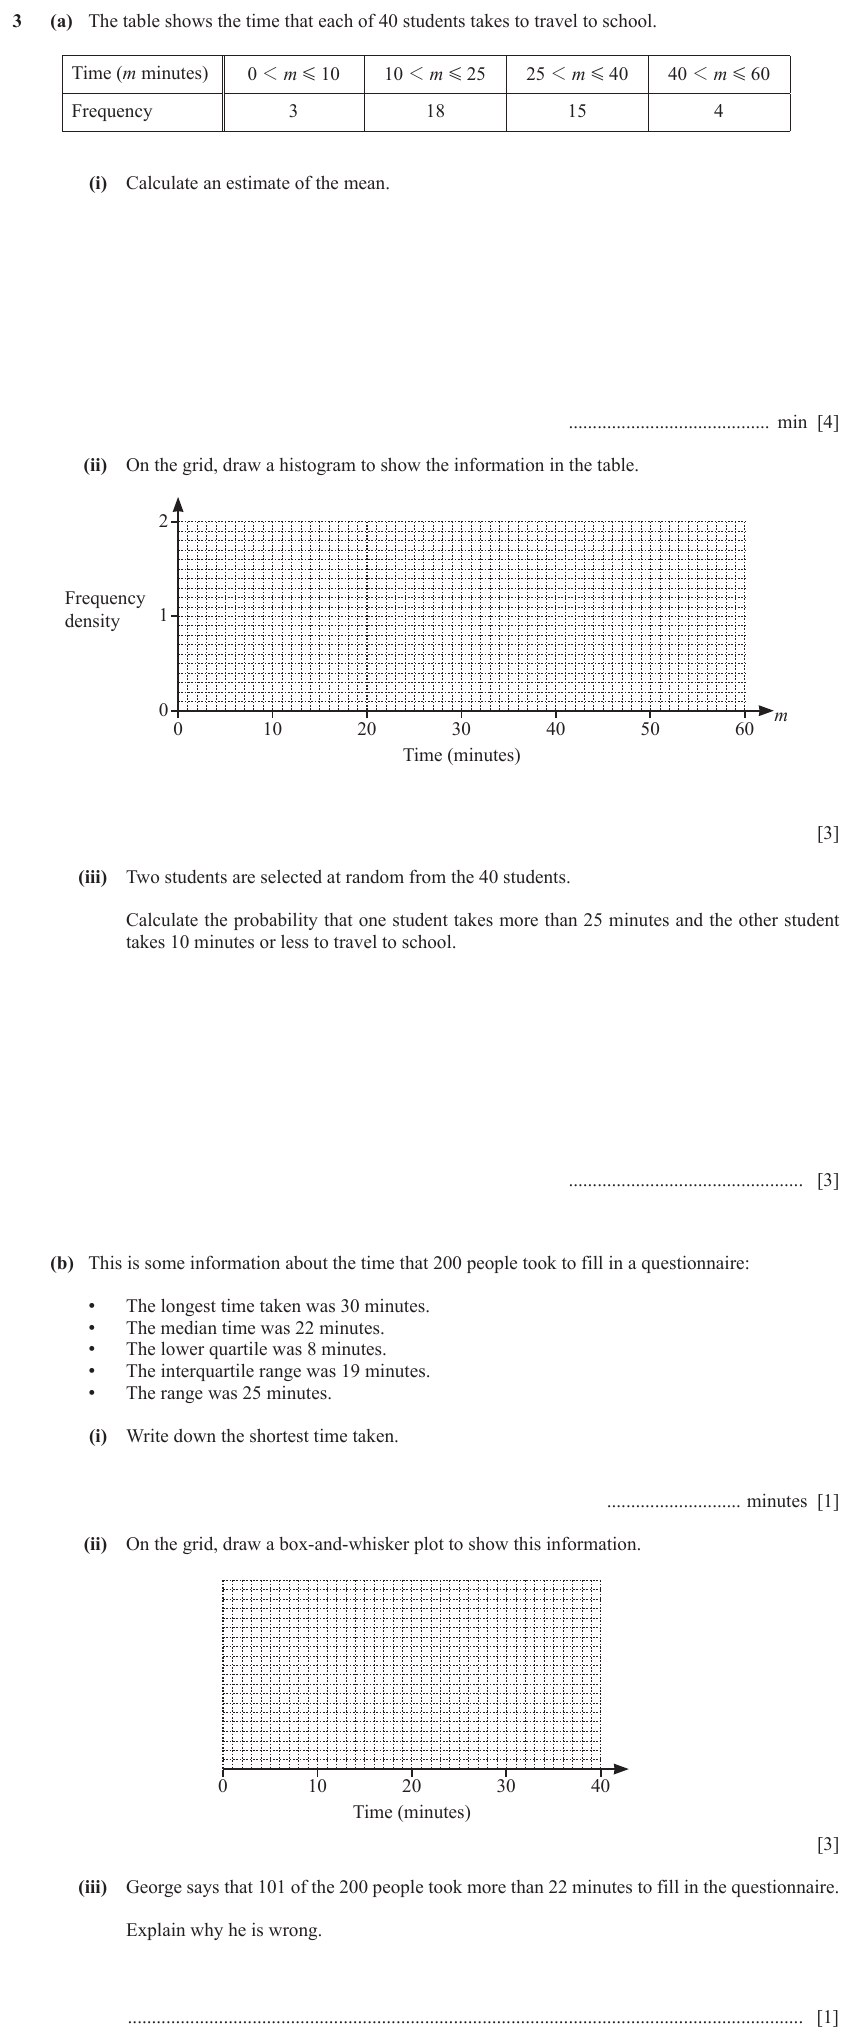
Question text
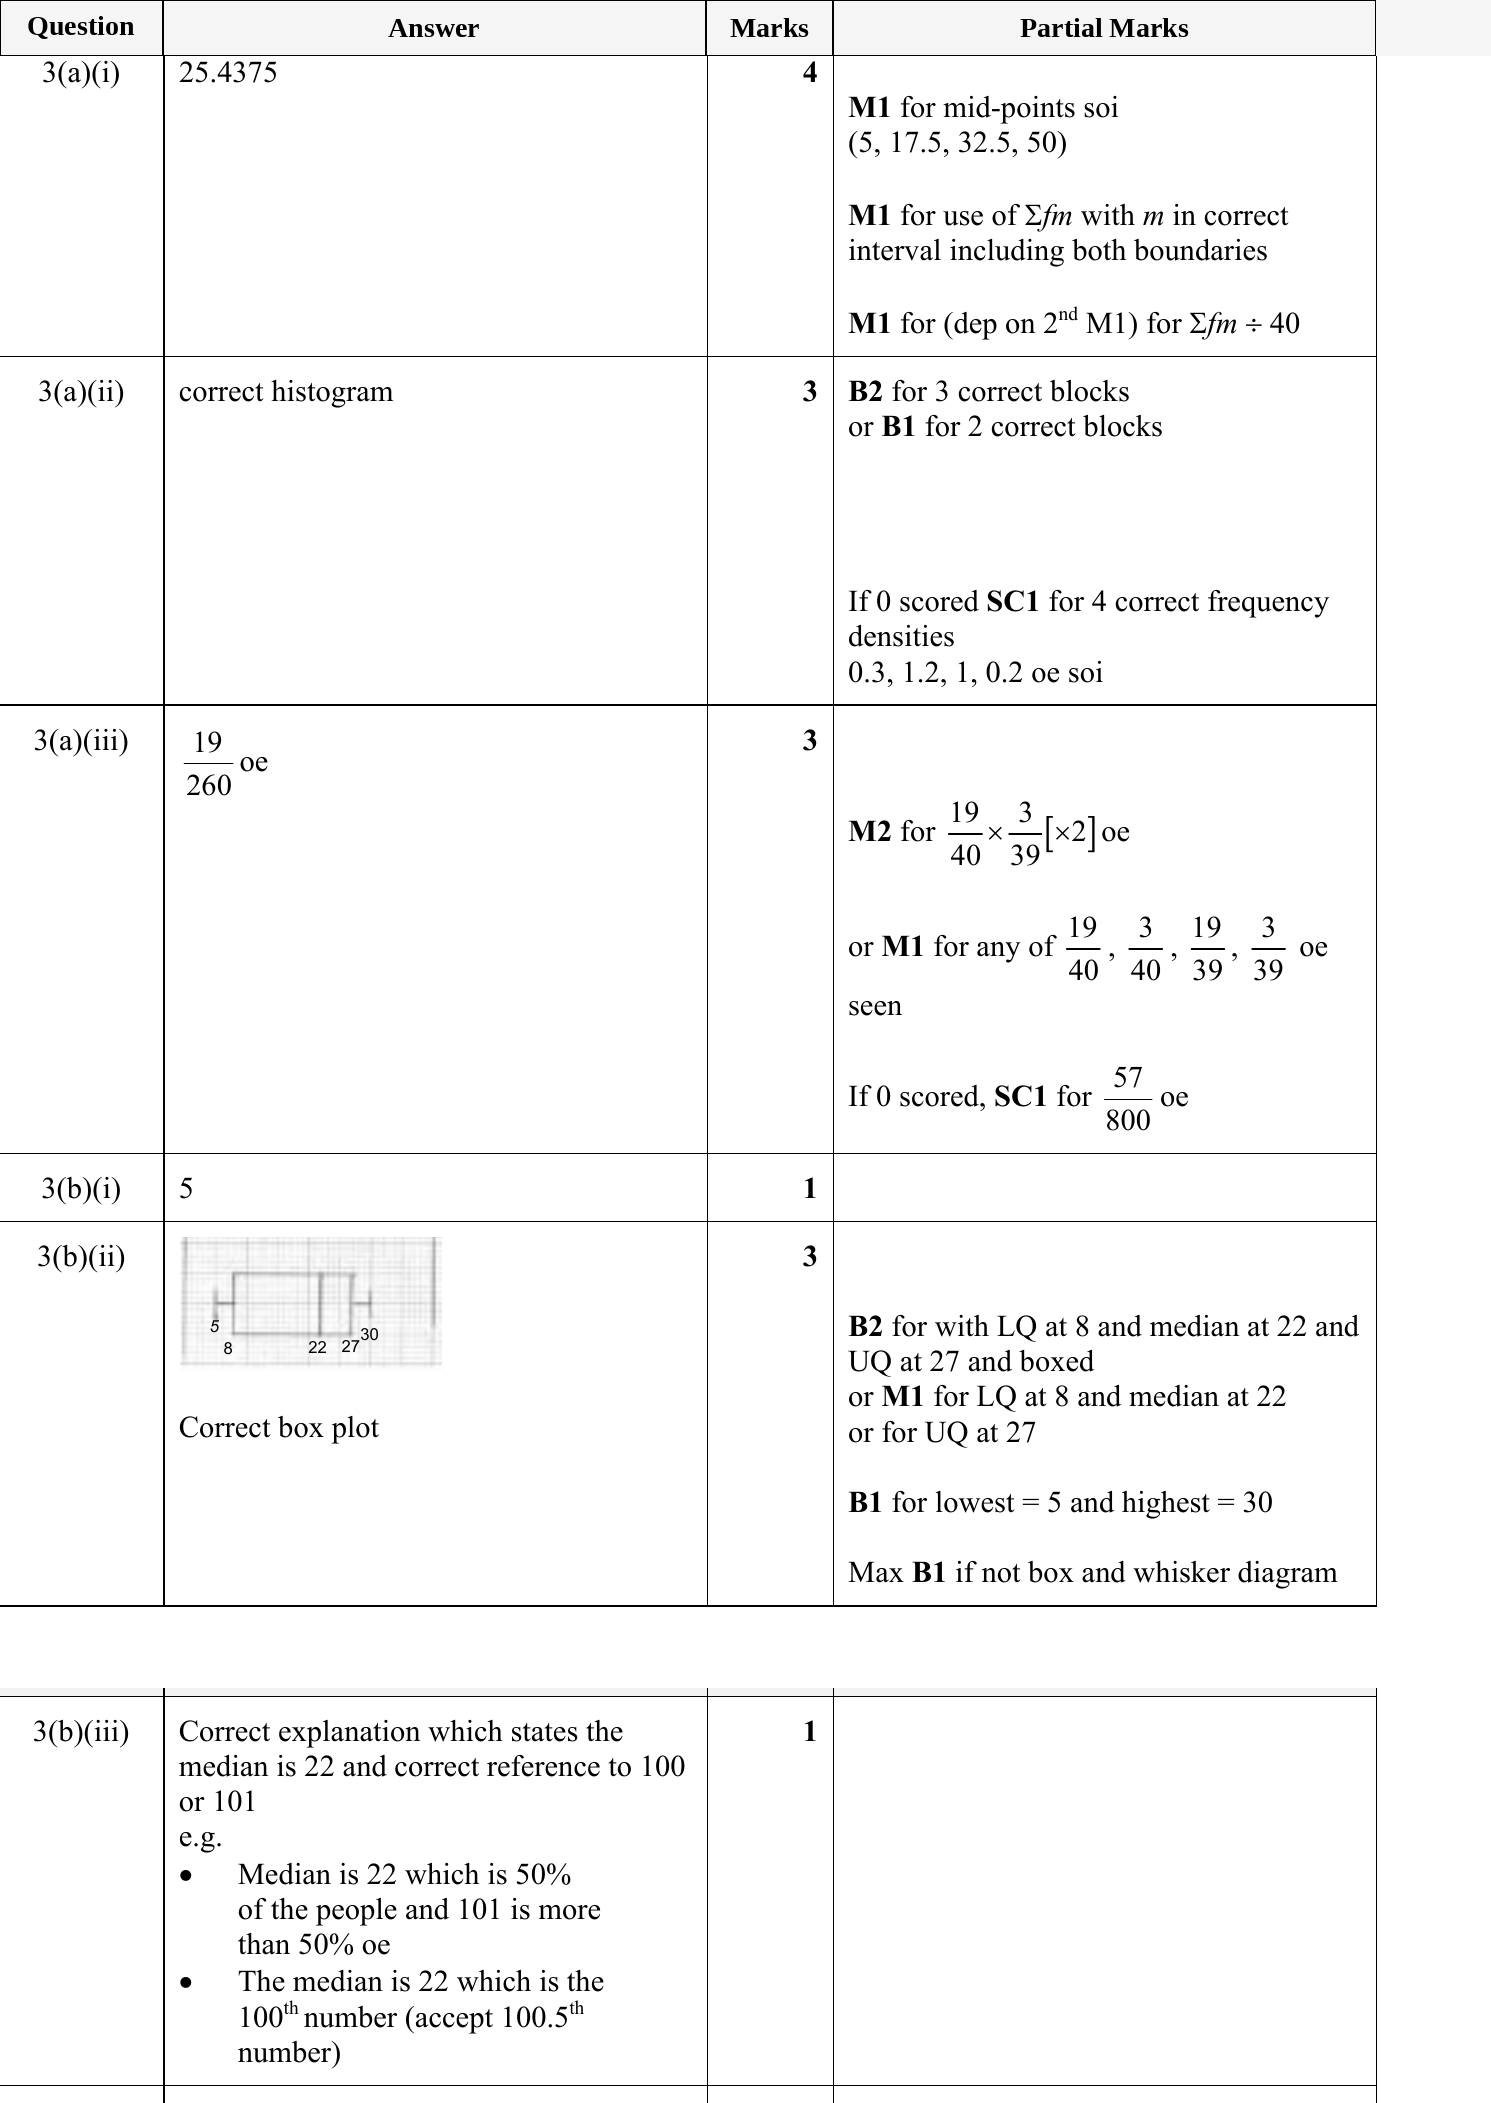
3 (a) The table shows the time that each of 40 students takes to travel to school.
Time (m minutes) 0 1 m G 10 10 1 m G 25 25 1 m G 40 40 1 m G 60
Frequency 3 18 15 4
(i) Calculate an estimate of the mean.
.......................................... min [4]
(ii) On the grid, draw a histogram to show the information in the table.
2
Frequency
1
density
0
m
0 10 20 30 40 50 60
Time (minutes)
[3]
(iii) Two students are selected at random from the 40 students.
Calculate the probability that one student takes more than 25 minutes and the other student
takes 10 minutes or less to travel to school.
................................................. [3]
© UCLES 2024 0580/42/M/J/24
7
(b) This is some information about the time that 200 people took to fill in a questionnaire:
• The longest time taken was 30 minutes.
• The median time was 22 minutes.
• The lower quartile was 8 minutes.
• The interquartile range was 19 minutes.
• The range was 25 minutes.
(i) Write down the shortest time taken.
............................ minutes [1]
(ii) On the grid, draw a box-and-whisker plot to show this information.
0 10 20 30 40
Time (minutes)
[3]
(iii) George says that 101 of the 200 people took more than 22 minutes to fill in the questionnaire.
Explain why he is wrong.
............................................................................................................................................. [1]
© UCLES 2024 0580/42/M/J/24 [Turn over
8
Mark scheme