Question 5 — IGCSE 0580 Oct/Nov 2024 Paper 42
Cambridge IGCSE Mathematics 0580, Extended tier, calculator. Topic: Statistics · Cumulative frequency. Worth 15 marks.
Open in interactive question bank →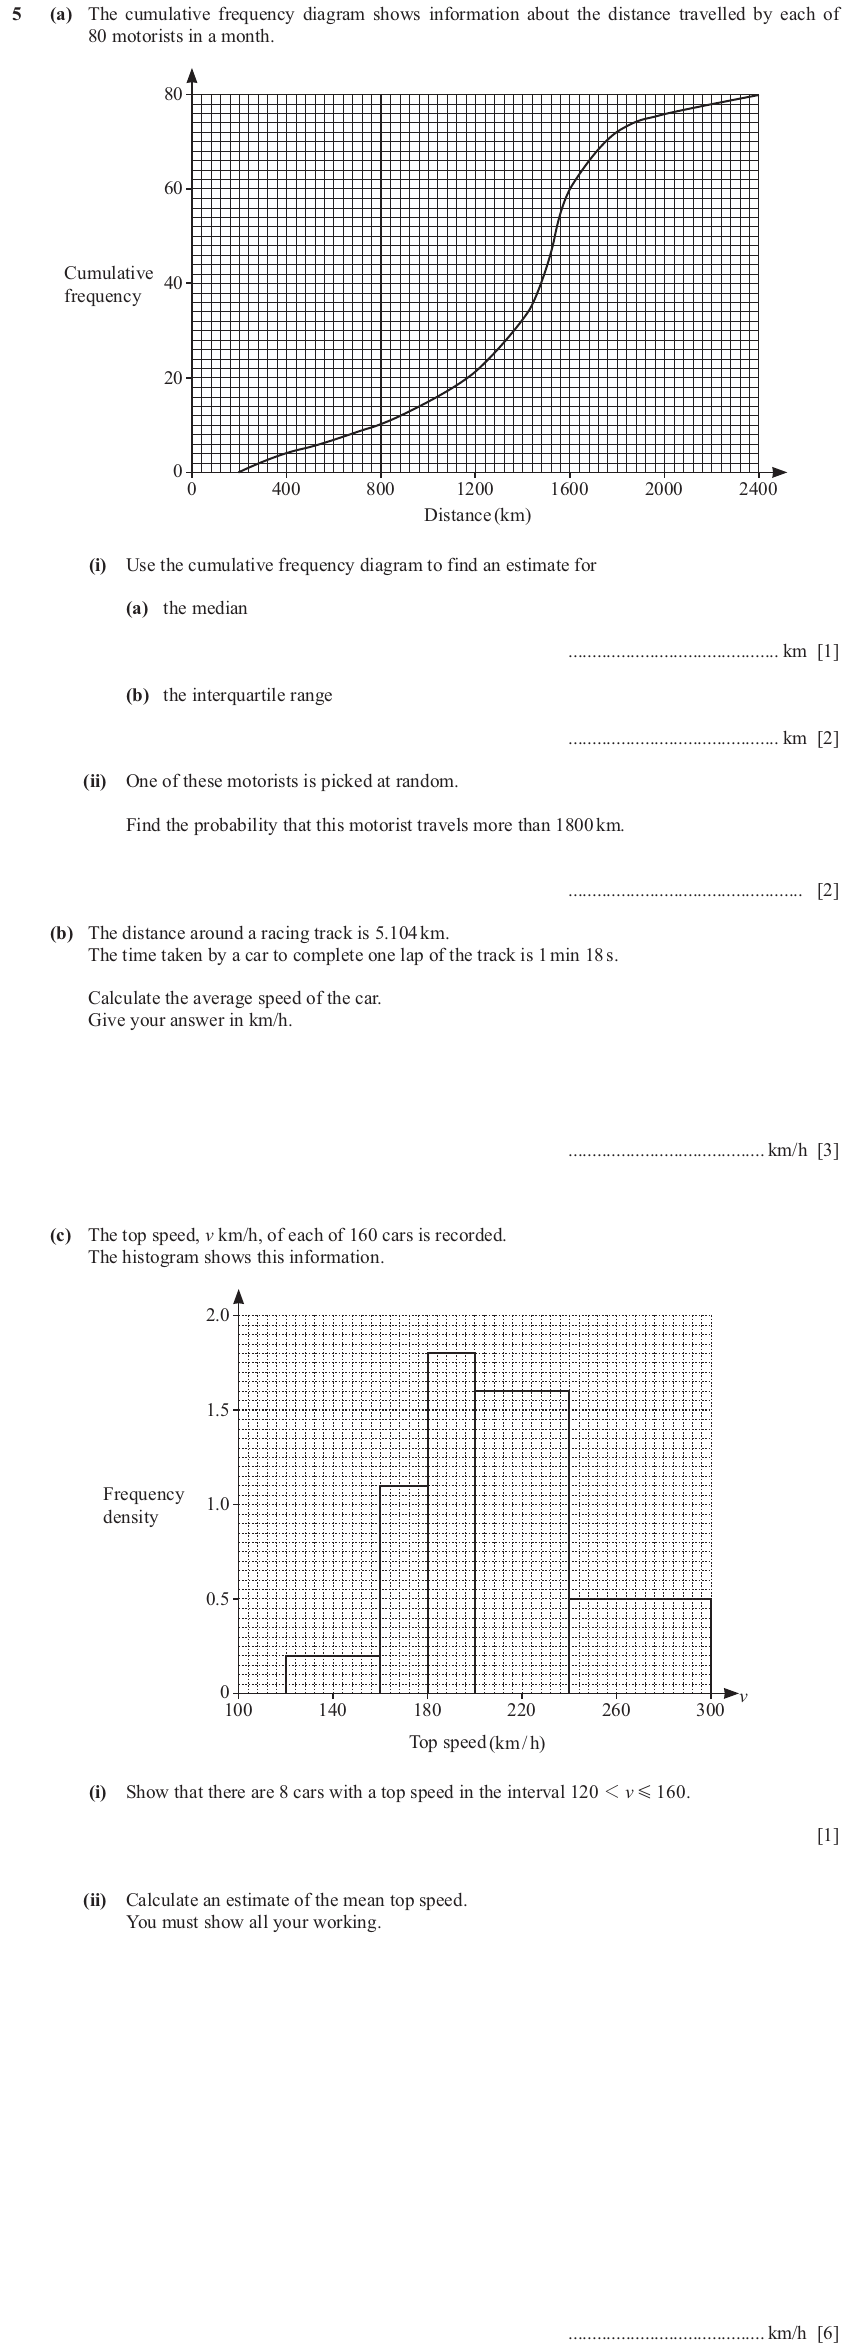
Question text
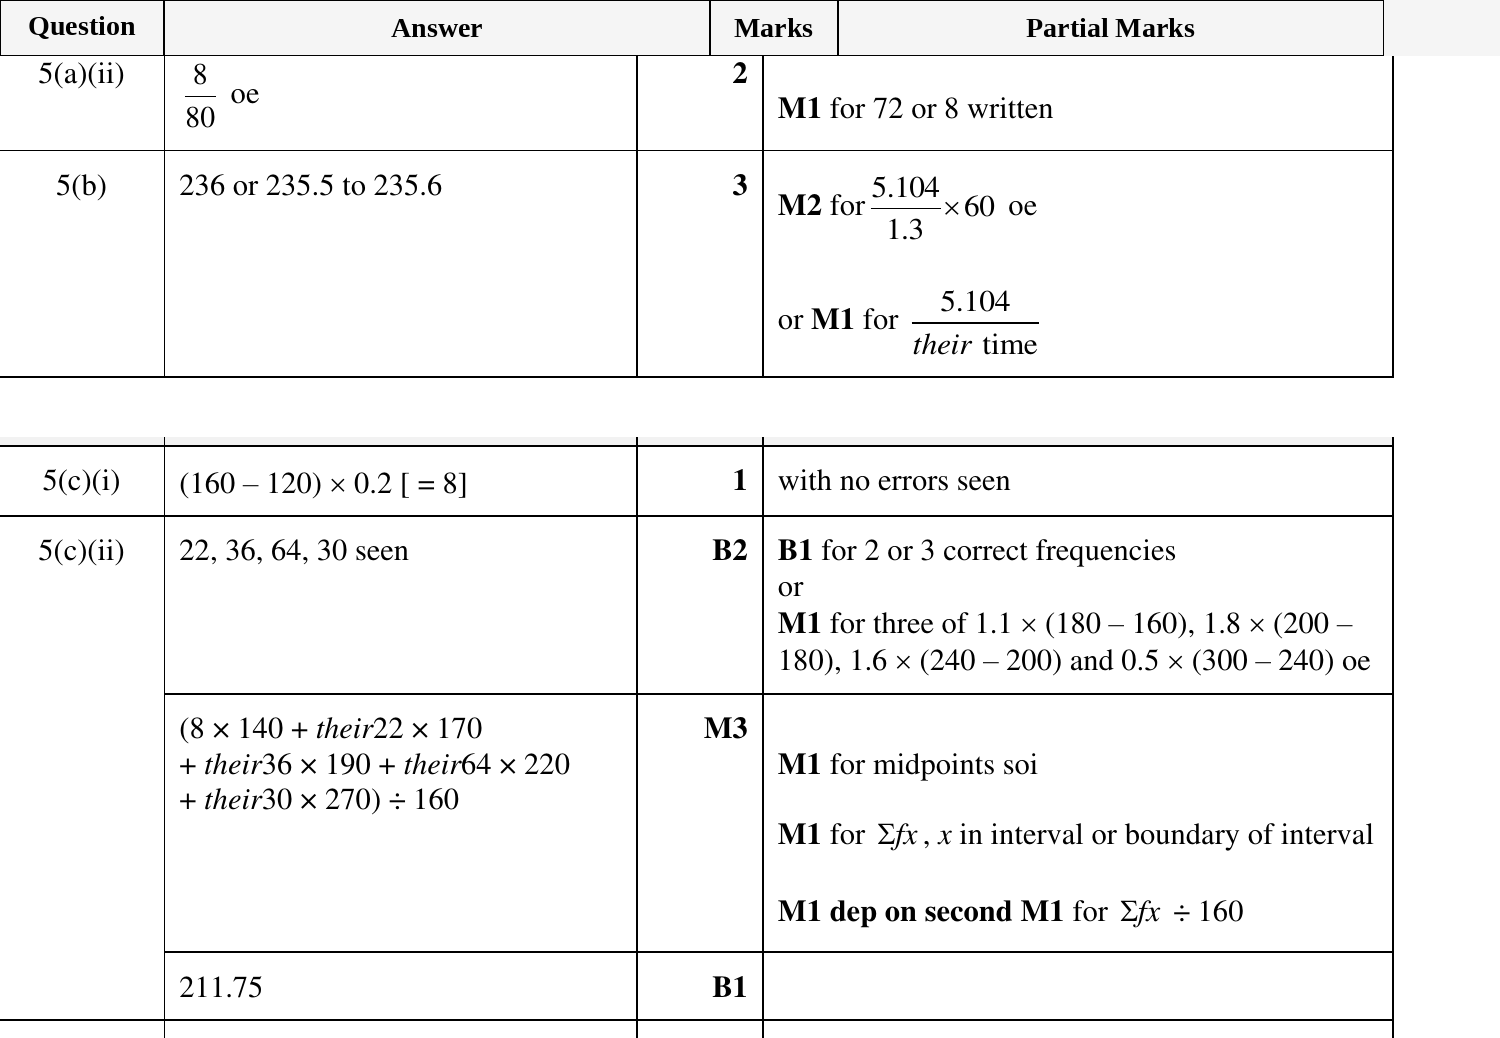
5 (a) The cumulative frequency diagram shows information about the distance travelled by each of
80 motorists in a month.
80
60
Cumulative
40
frequency
20
0
0 400 800 1200 1600 2000 2400
Distance (km)
(i) Use the cumulative frequency diagram to find an estimate for
(a) the median
............................................ km [1]
(b) the interquartile range
............................................ km [2]
(ii) One of these motorists is picked at random.
Find the probability that this motorist travels more than 1800 km.
................................................. [2]
(b) The distance around a racing track is 5.104 km.
The time taken by a car to complete one lap of the track is 1 min 18 s.
Calculate the average speed of the car .
Give your answer in km/h.
......................................... km/h [3]
(cid:300)(cid:217)(cid:266)(cid:174)(cid:288)(cid:180)(cid:237)(cid:200)(cid:245)(cid:207)(cid:298)(cid:197)(cid:266)(cid:222)(cid:251)(cid:183)(cid:254)(cid:215)
© UCLES 2024 (cid:300)(cid:234)(cid:219)(cid:249)(cid:212)(cid:300)(cid:256)(cid:259)(cid:210)(cid:247)(cid:238)(cid:180)(cid:174)(cid:277)(cid:279)(cid:273)(cid:297)(cid:258) 0580/42/O/N/24
(cid:293)(cid:229)(cid:229)(cid:213)(cid:181)(cid:277)(cid:197)(cid:245)(cid:197)(cid:197)(cid:245)(cid:197)(cid:197)(cid:245)(cid:229)(cid:181)(cid:261)(cid:213)
M
SIHT
NI
ETIRW
TON
OD
NIGRAM
SIHT
NI
ETIRW
TON
OD
NIGRAM
SIHT
NI
ETIRW
TON
OD
NIGRAM
SIHT
NI
ETIRW
TON
OD
NIGRAM
SIHT
NI
ETIRW
TON
OD
* 0000800000011 *
11
(cid:44)(cid:1)(cid:1)(cid:1)(cid:1)(cid:9)(cid:1)(cid:1)(cid:1)(cid:1)(cid:1)(cid:1)(cid:2)(cid:2)(cid:44)
(c) The top speed, v km/h, of each of 160 cars is recorded.
The histogram shows this information.
2.0
1.5
Frequency
1.0
density
0.5
0 v
100 140 180 220 260 300
Top speed (km / h)
(i) Show that there are 8 cars with a top speed in the interval 120 1 v G 160.
[1]
(ii) Calculate an estimate of the mean top speed.
You must show all your working.
......................................... km/h [6]
(cid:300)(cid:219)(cid:266)(cid:174)(cid:288)(cid:180)(cid:237)(cid:200)(cid:245)(cid:207)(cid:298)(cid:197)(cid:266)(cid:222)(cid:249)(cid:183)(cid:254)(cid:215) [Turn over
© UCLES 2024 (cid:300)(cid:234)(cid:220)(cid:250)(cid:220)(cid:286)(cid:260)(cid:243)(cid:231)(cid:257)(cid:259)(cid:245)(cid:298)(cid:285)(cid:195)(cid:273)(cid:281)(cid:258) 0580/42/O/N/24
(cid:293)(cid:229)(cid:213)(cid:277)(cid:245)(cid:245)(cid:229)(cid:277)(cid:213)(cid:181)(cid:229)(cid:197)(cid:197)(cid:277)(cid:197)(cid:245)(cid:277)(cid:213)
NIGRAM
SIHT
NI
ETIRW
TON
OD
NIGRAM
SIHT
NI
ETIRW
TON
OD
NIGRAM
SIHT
NI
ETIRW
TON
OD
NIGRAM
SIHT
NI
ETIRW
TON
OD
NIGRAM
SIHT
NI
ETIRW
TON
OD
* 0000800000012 *
12
(cid:44)(cid:1)(cid:1)(cid:1)(cid:1)(cid:9)(cid:1)(cid:1)(cid:1)(cid:1)(cid:1)(cid:1)(cid:2)(cid:3)(cid:44)
3 2
NIGRAM
S
Mark scheme