Question 3 — IGCSE 0580 Oct/Nov 2024 Paper 41
Cambridge IGCSE Mathematics 0580, Extended tier, calculator. Topic: Statistics · Grouped data. Worth 8 marks.
Open in interactive question bank →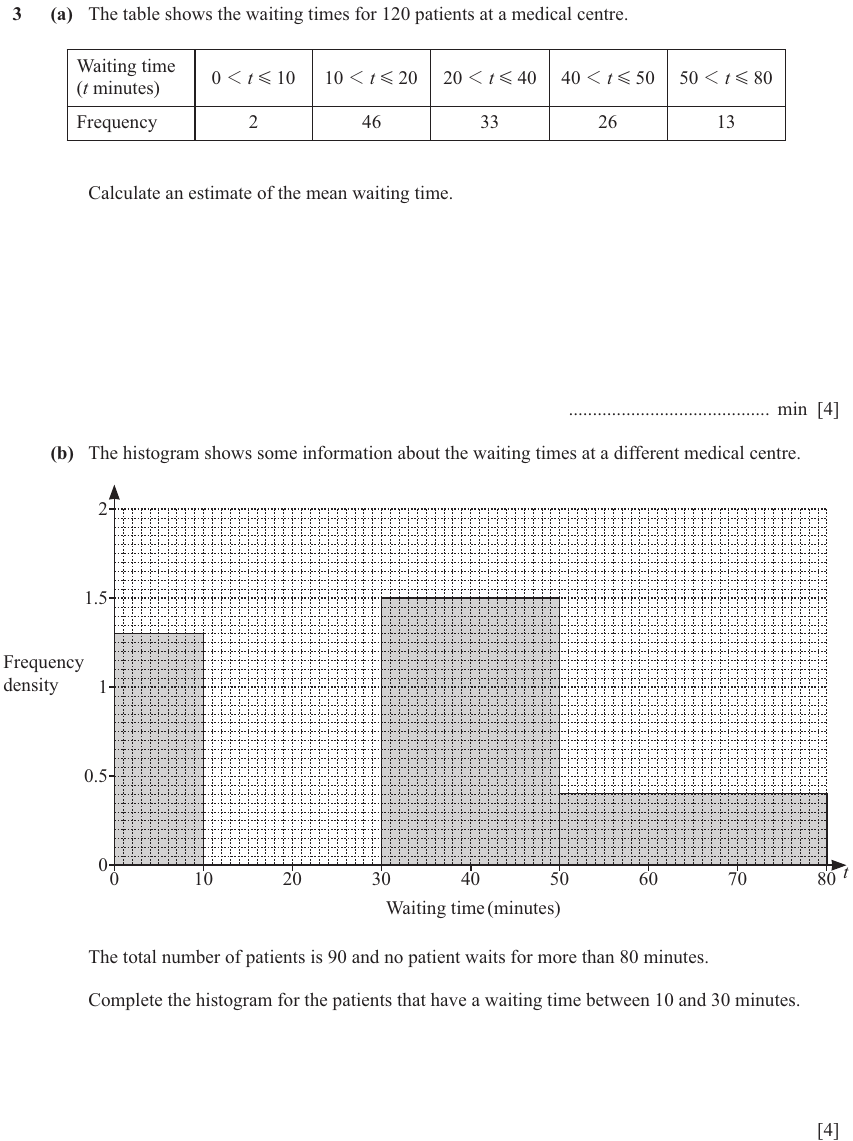
Question text
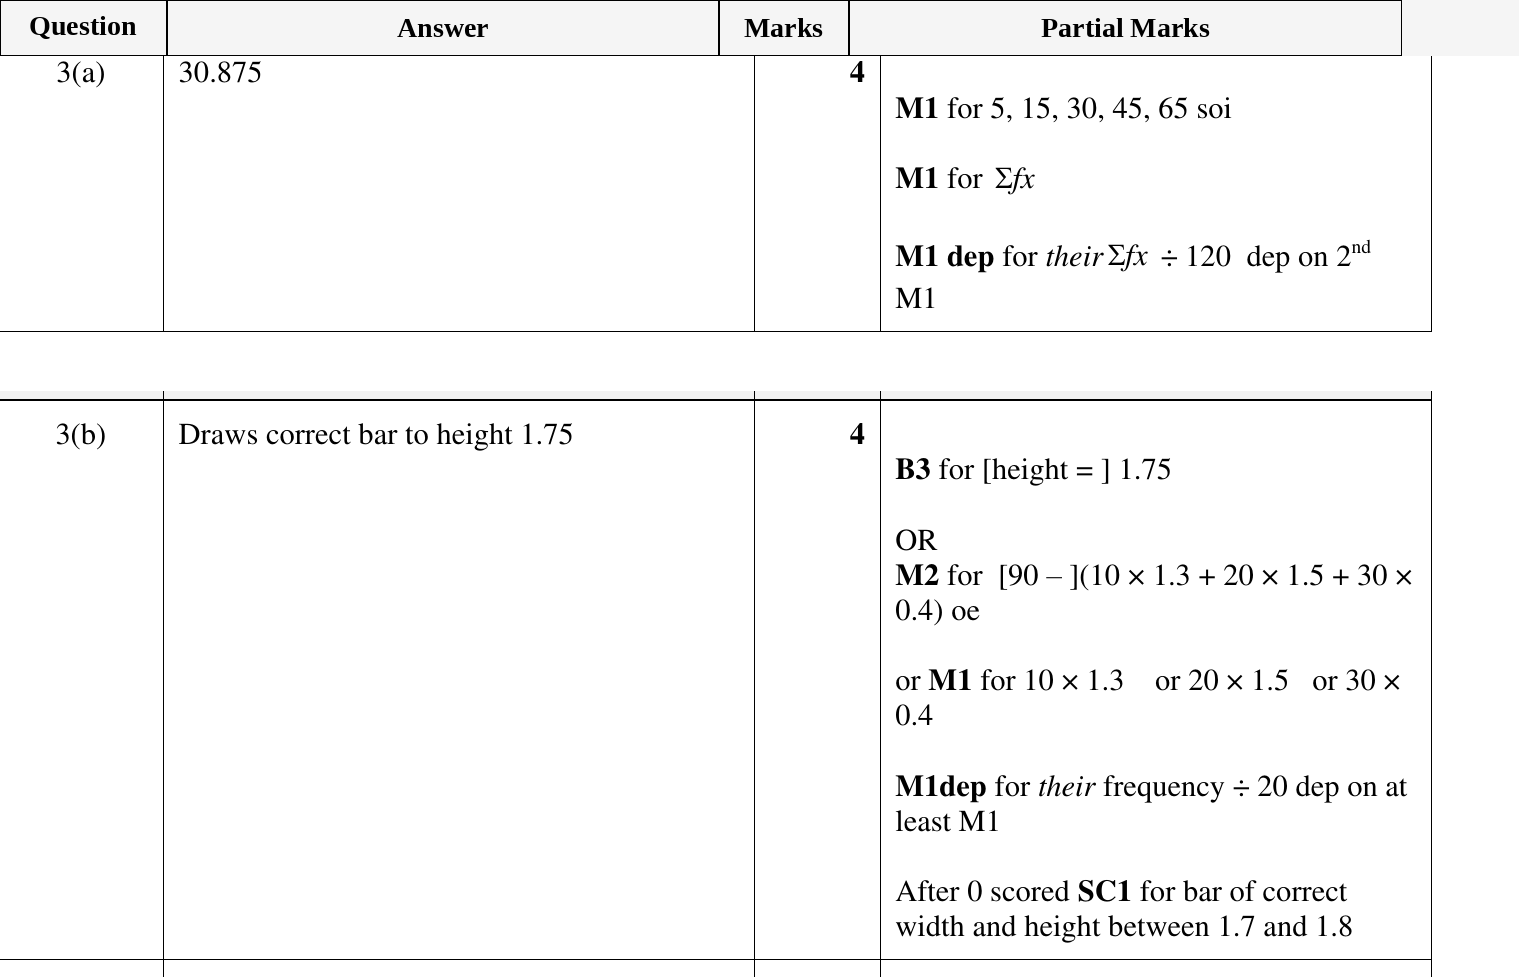
3 (a) The table shows the waiting times for 120 patients at a medical centre.
Waiting time
0 1 t G 10 10 1 t G 20 20 1 t G 40 40 1 t G 50 50 1 t G 80
(t minutes)
Frequency 2 46 33 26 13
Calculate an estimate of the mean waiting time.
.......................................... min [4]
(b) The histogram shows some information about the waiting times at a different medical centre.
2
1.5
Frequency
density 1
0.5
0
t
0 10 20 30 40 50 60 70 80
Waiting time (minutes)
The total number of patients is 90 and no patient waits for more than 80 minutes.
Complete the histogram for the patients that have a waiting time between 10 and 30 minutes.
[4]
(cid:300)(cid:215)(cid:266)(cid:174)(cid:288)(cid:180)(cid:237)(cid:200)(cid:245)(cid:207)(cid:298)(cid:197)(cid:266)(cid:221)(cid:250)(cid:183)(cid:256)(cid:215) [Turn over
© UCLES 2024 (cid:300)(cid:228)(cid:188)(cid:244)(cid:209)(cid:293)(cid:239)(cid:249)(cid:205)(cid:239)(cid:247)(cid:240)(cid:285)(cid:192)(cid:200)(cid:236)(cid:287)(cid:258) 0580/41/O/N/24
(cid:293)(cid:197)(cid:213)(cid:213)(cid:181)(cid:277)(cid:197)(cid:277)(cid:293)(cid:245)(cid:213)(cid:261)(cid:197)(cid:245)(cid:261)(cid:181)(cid:197)(cid:213)
M
SIHT
NI
ETIRW
TON
OD
NIGRAM
SIHT
NI
ETIRW
TON
OD
NIGRAM
SIHT
NI
ETIRW
TON
OD
NIGRAM
SIHT
NI
ETIRW
TON
OD
NIGRAM
SIHT
NI
ETIRW
TON
OD
* 0000800000006 *
6
(cid:44)(cid:1)(cid:1)(cid:1)(cid:1)(cid:9)(cid:1)(cid:1)(cid:1)(cid:1)(cid:1)(cid:1)(cid:1)(cid:7)(cid:44)
NIGRAM
Mark scheme