Edexcel IGCSE·Mathematics 4MA1
Statistical Graphs
Key knowledge — Statistics
Formulas & equations
Mean = Σfx ÷ Σf (for frequency tables)Range = maximum − minimumInterquartile range (IQR) = Q3 − Q1Median from cumulative frequency: read off at n/2Q1 at n/4; Q3 at 3n/4Frequency density = frequency ÷ class width (for histograms)
Key facts & rules
- Mean uses all values — affected by outliers.
- Median is the middle value when ordered — not affected by outliers.
- Mode is the most frequent value.
- For grouped data: use midpoints to estimate the mean.
- Cumulative frequency graph: S-shaped curve; read median and quartiles from it.
- Box-and-whisker plots: show median, Q1, Q3, min and max.
- Positive correlation: both variables increase together. Negative: one increases as other decreases.
- The line of best fit passes through the mean point (x̄, ȳ).
Statistical graphs
19 Edexcel IGCSE 4MA1 past paper questions on statistical graphs — Foundation and Higher, with mark schemes.
Question 1 of 19
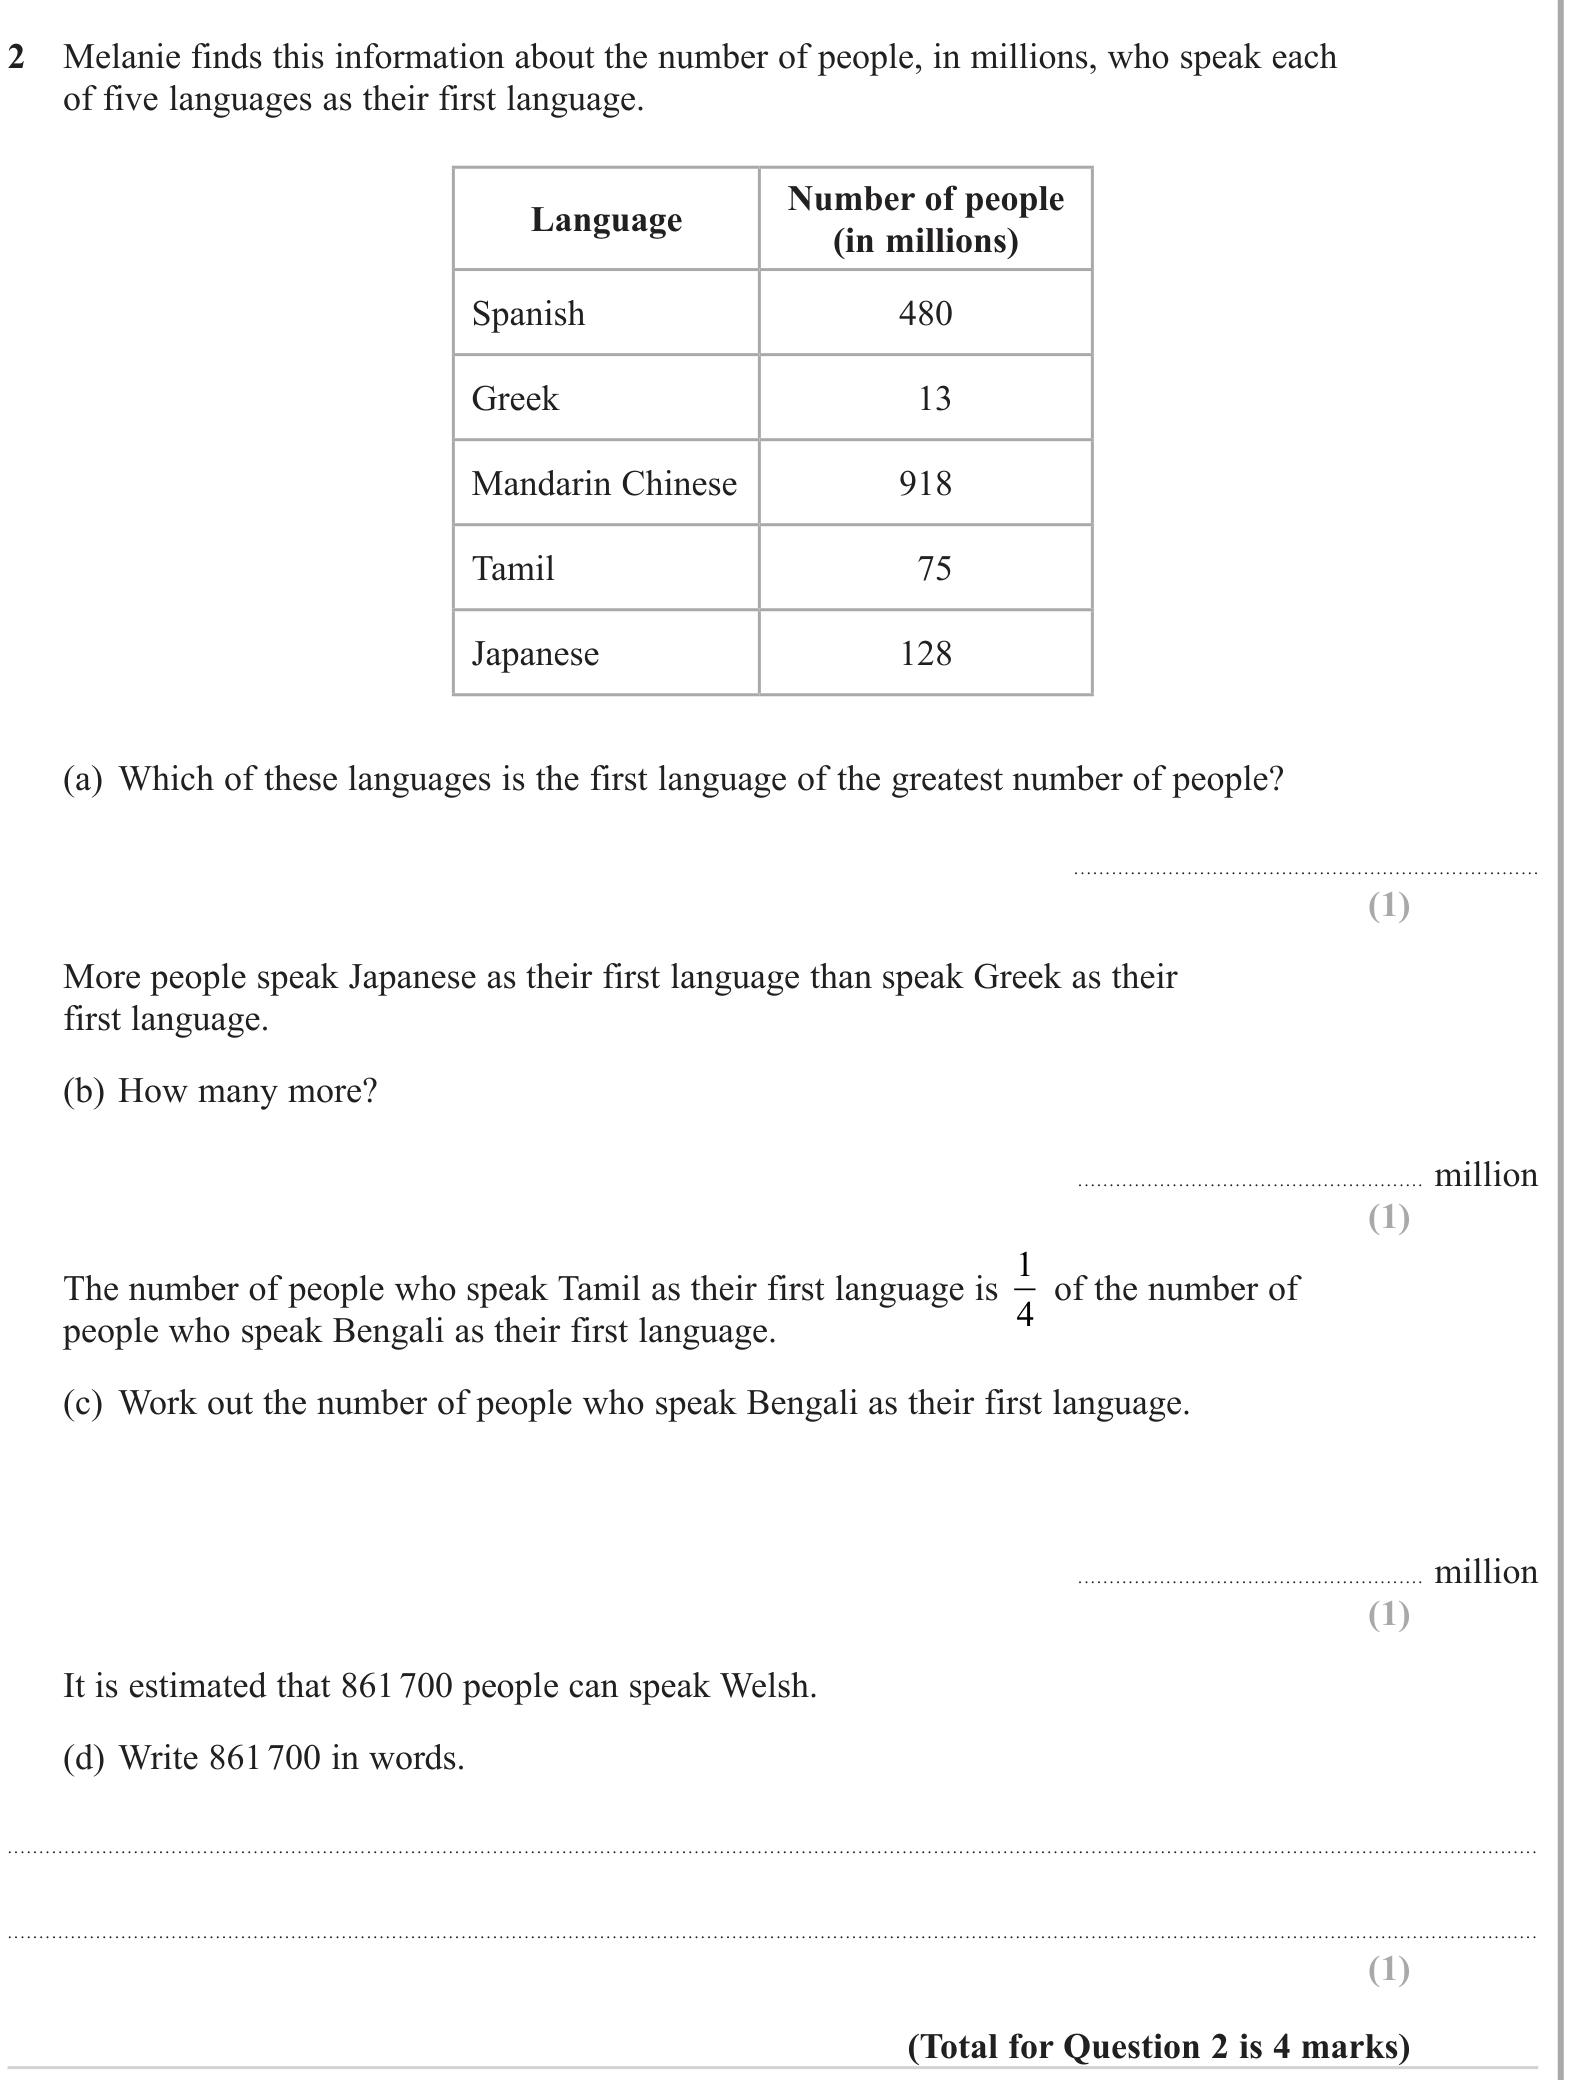
Show mark scheme

Question 2 of 19
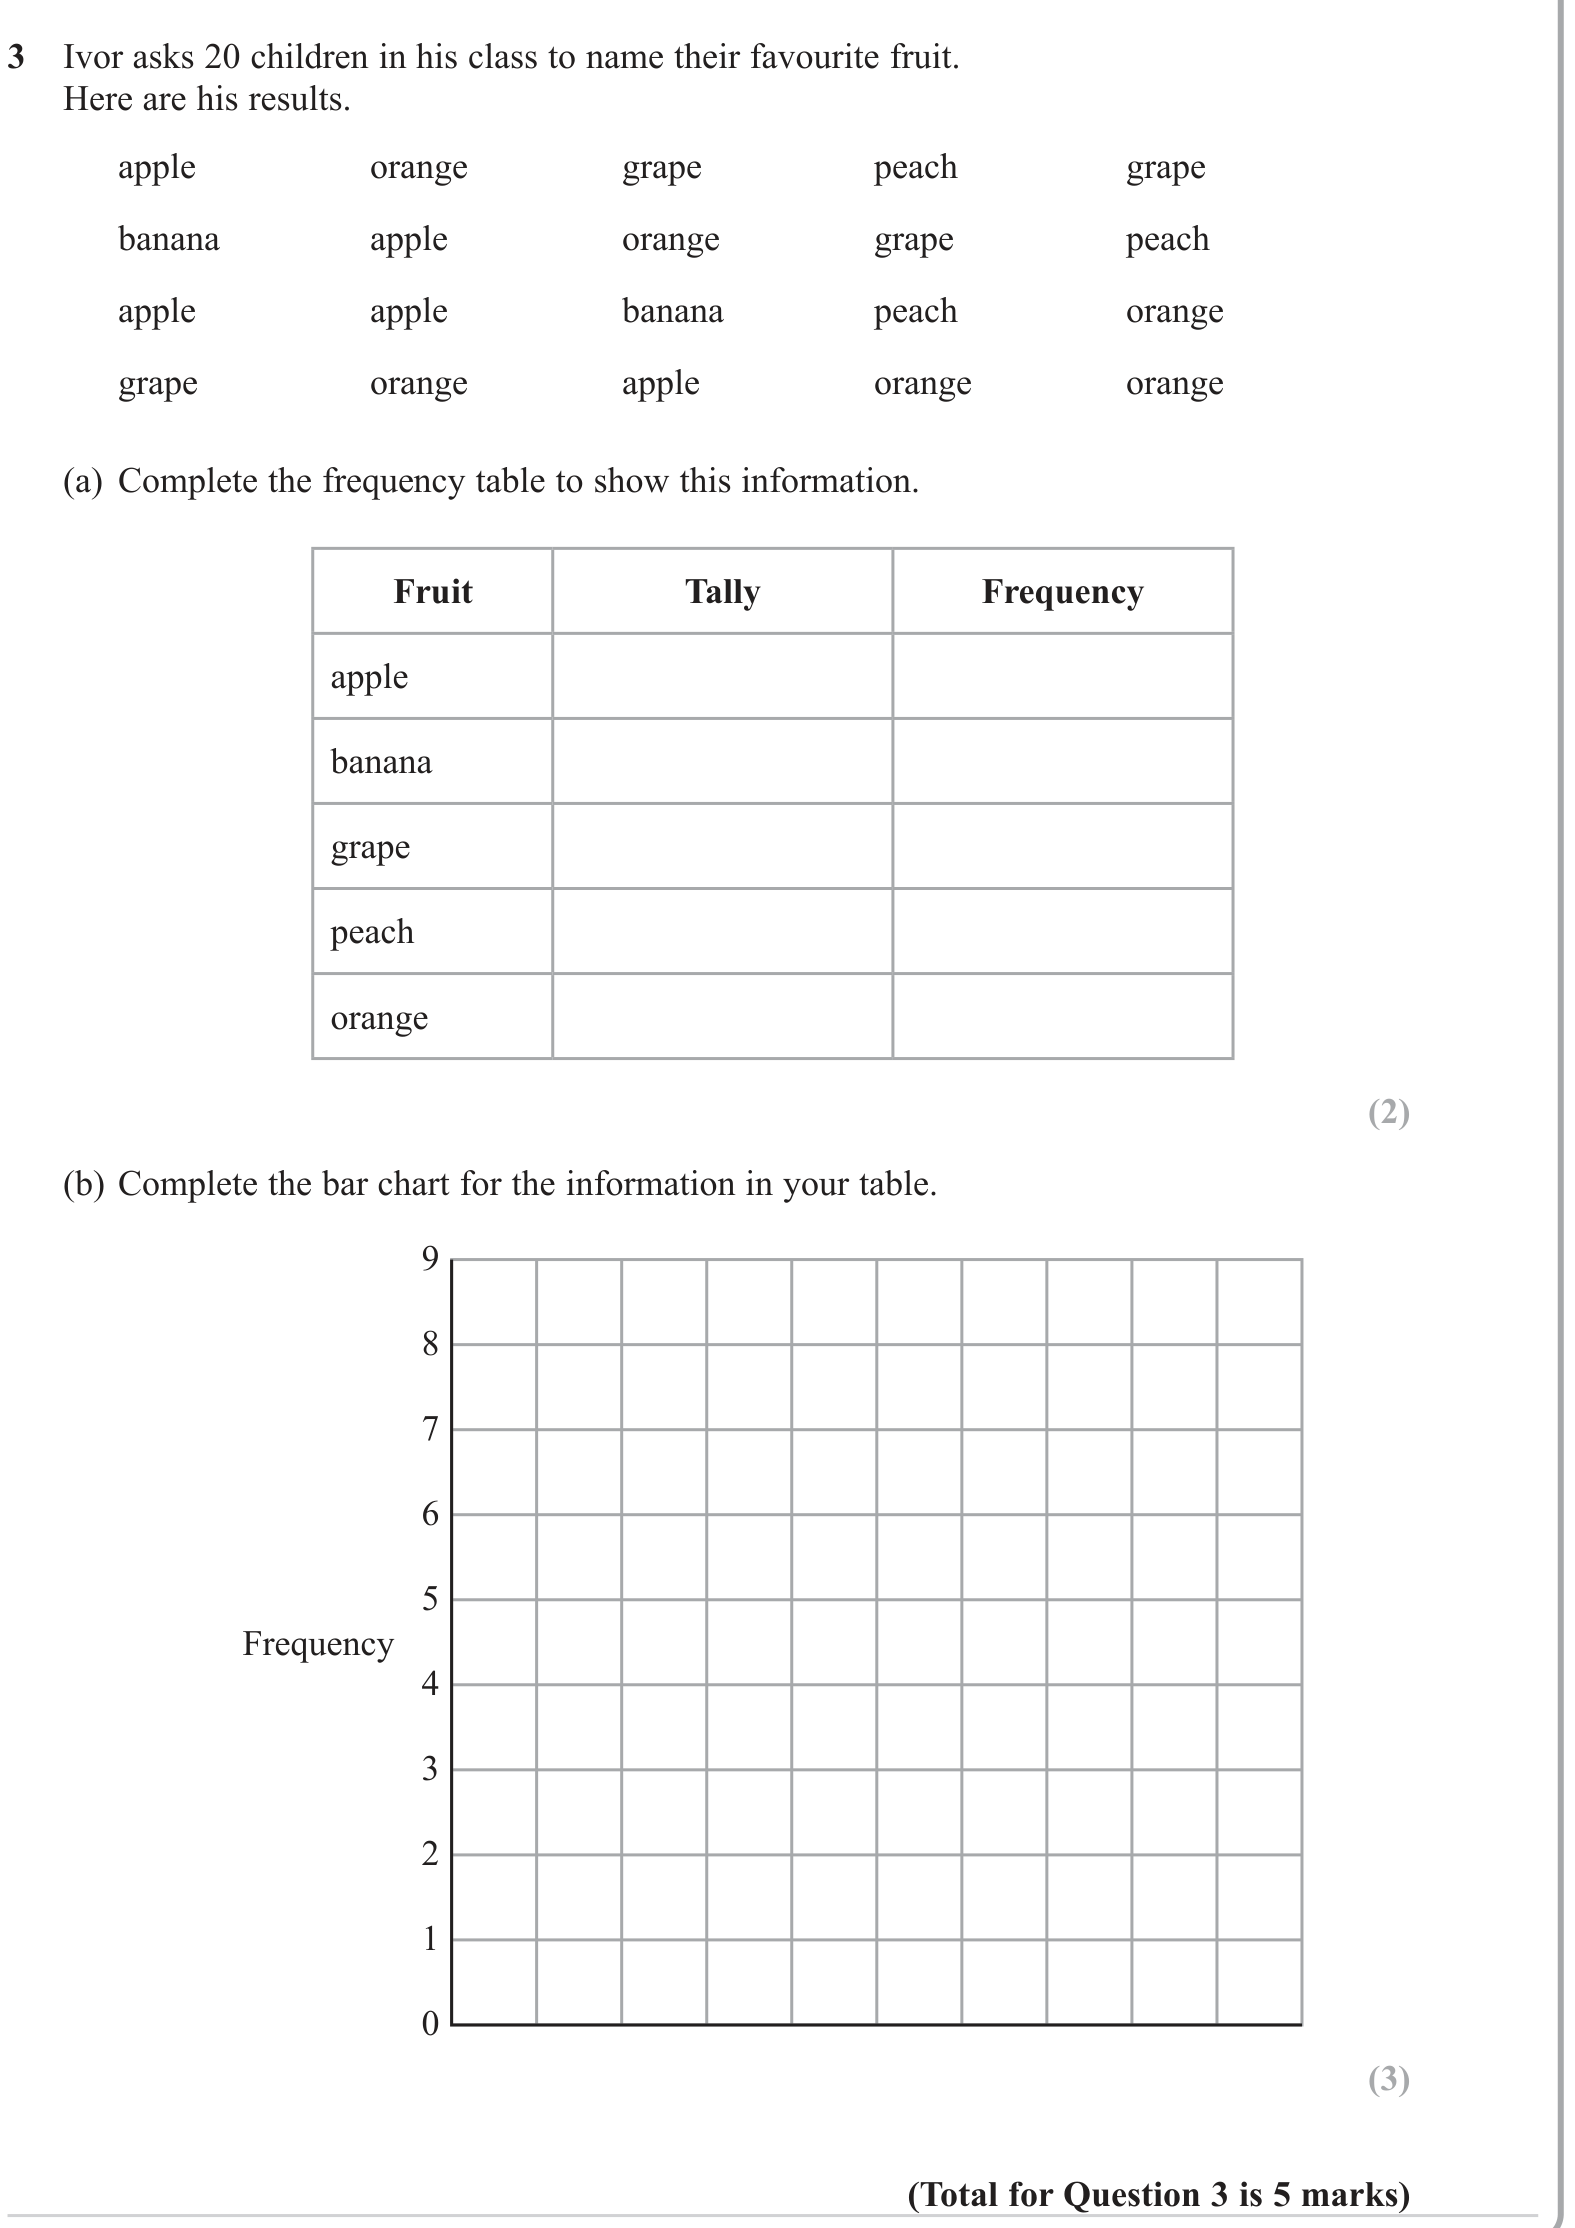
Show mark scheme

Question 3 of 19
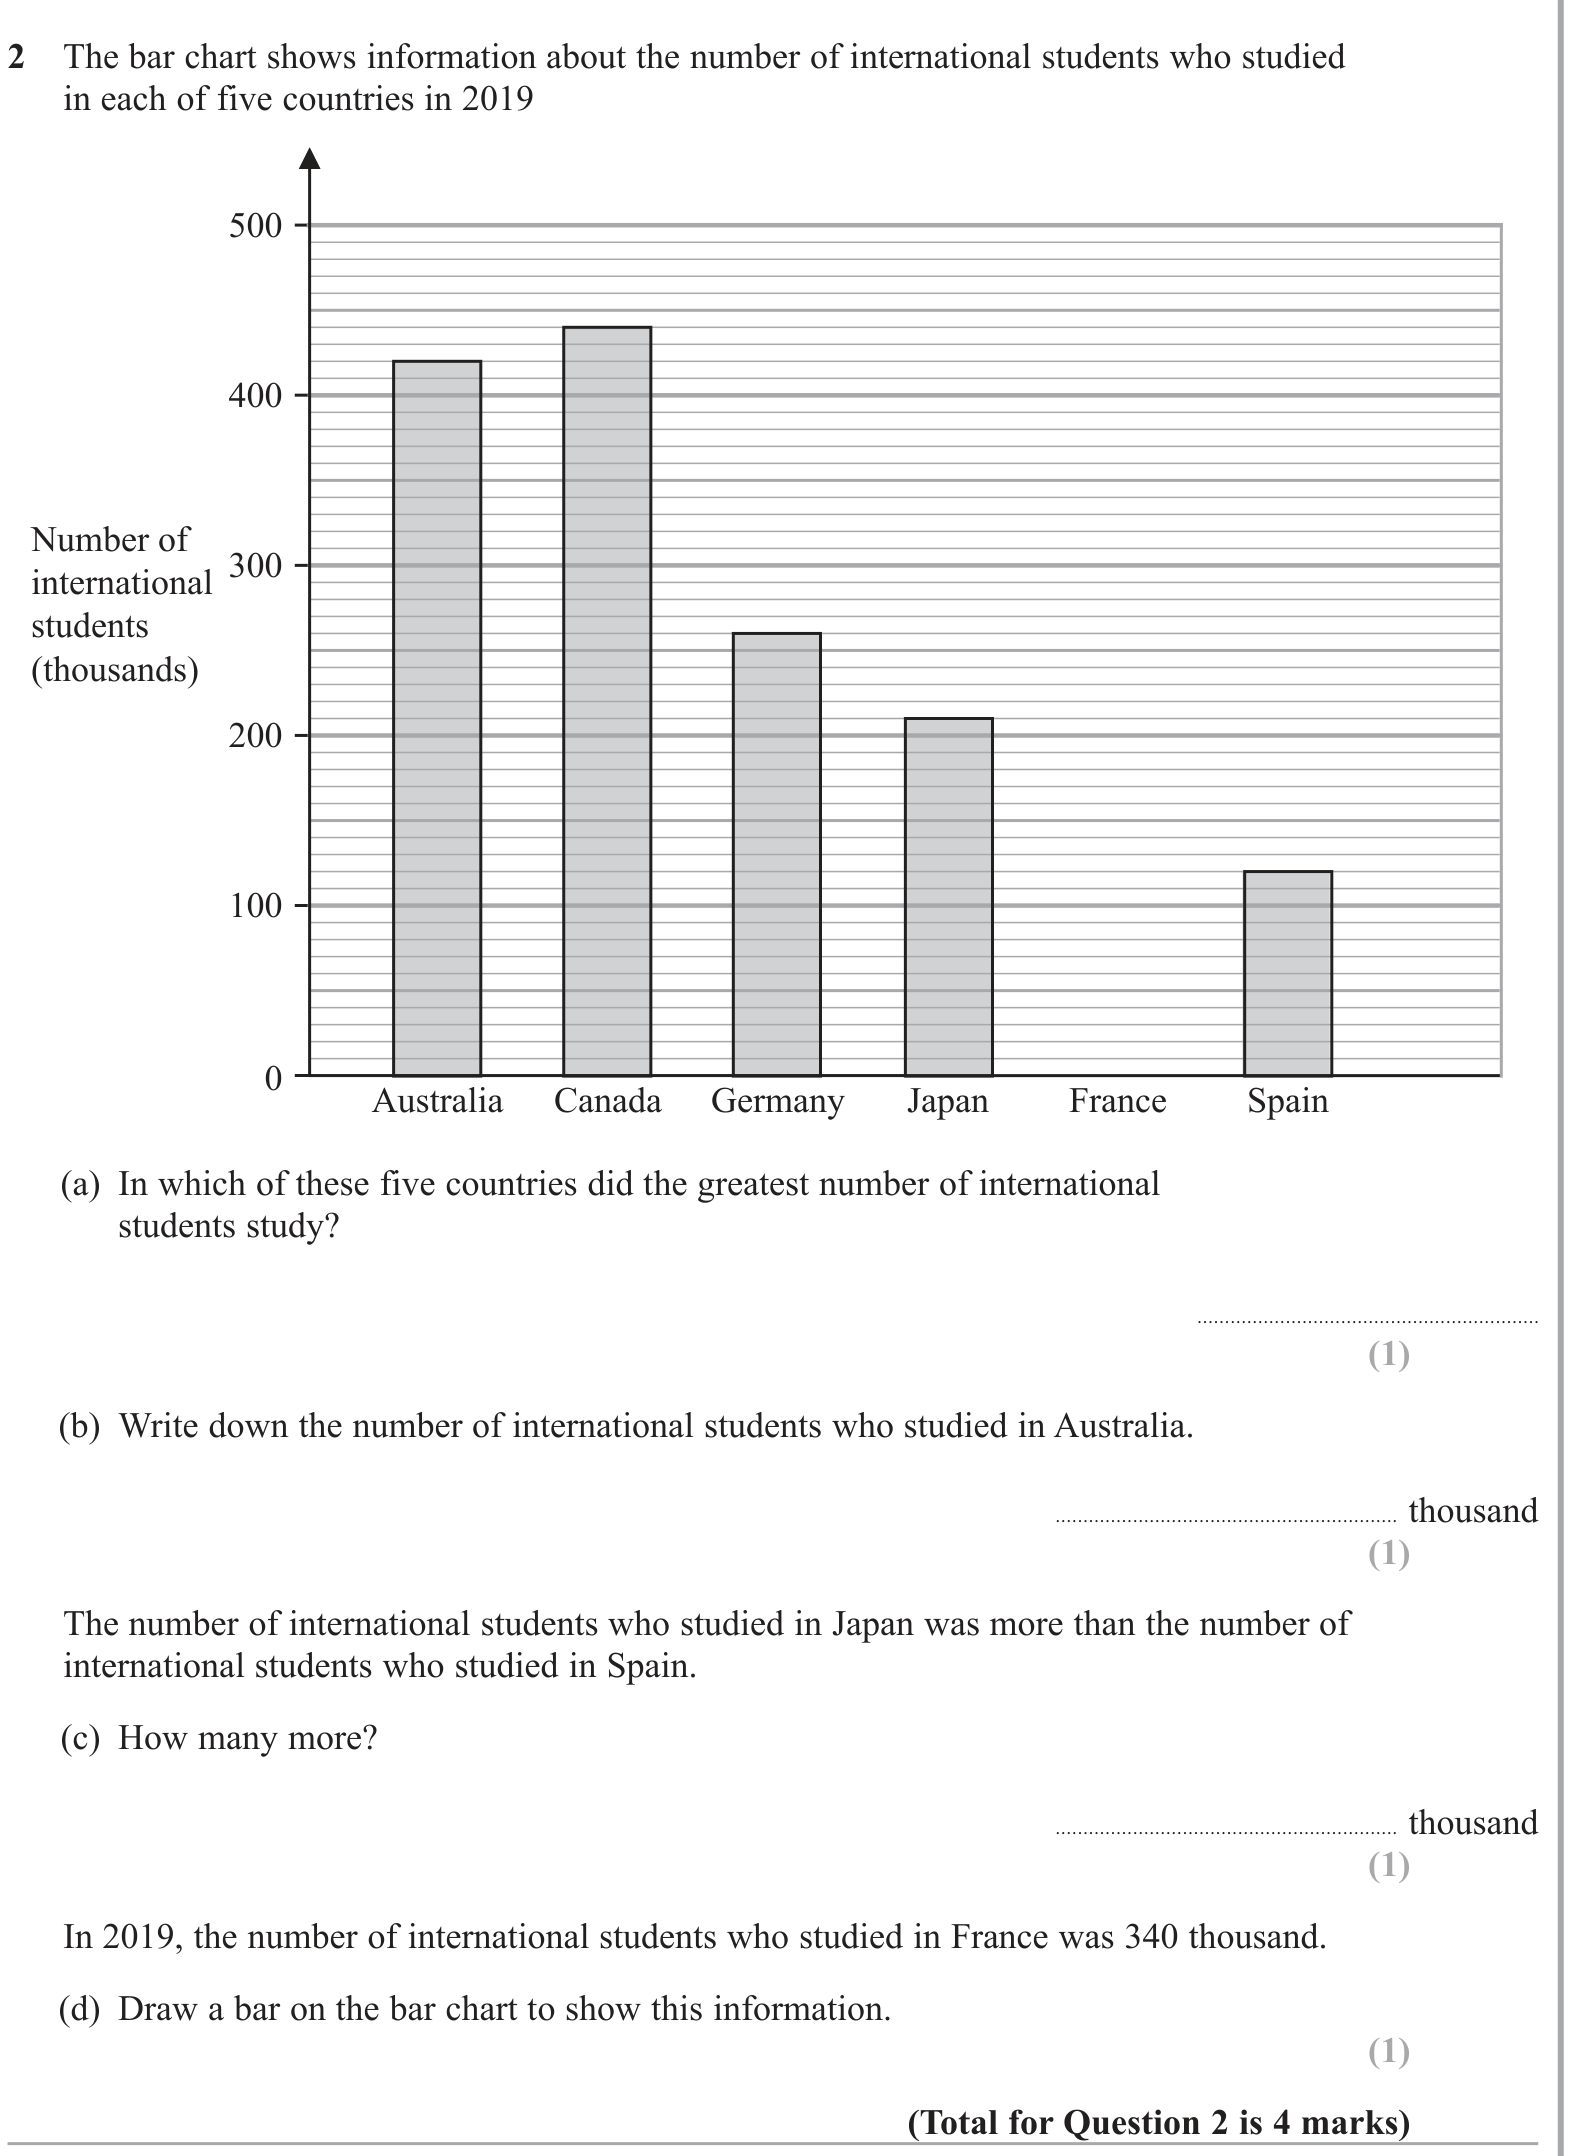
Show mark scheme

Question 4 of 19
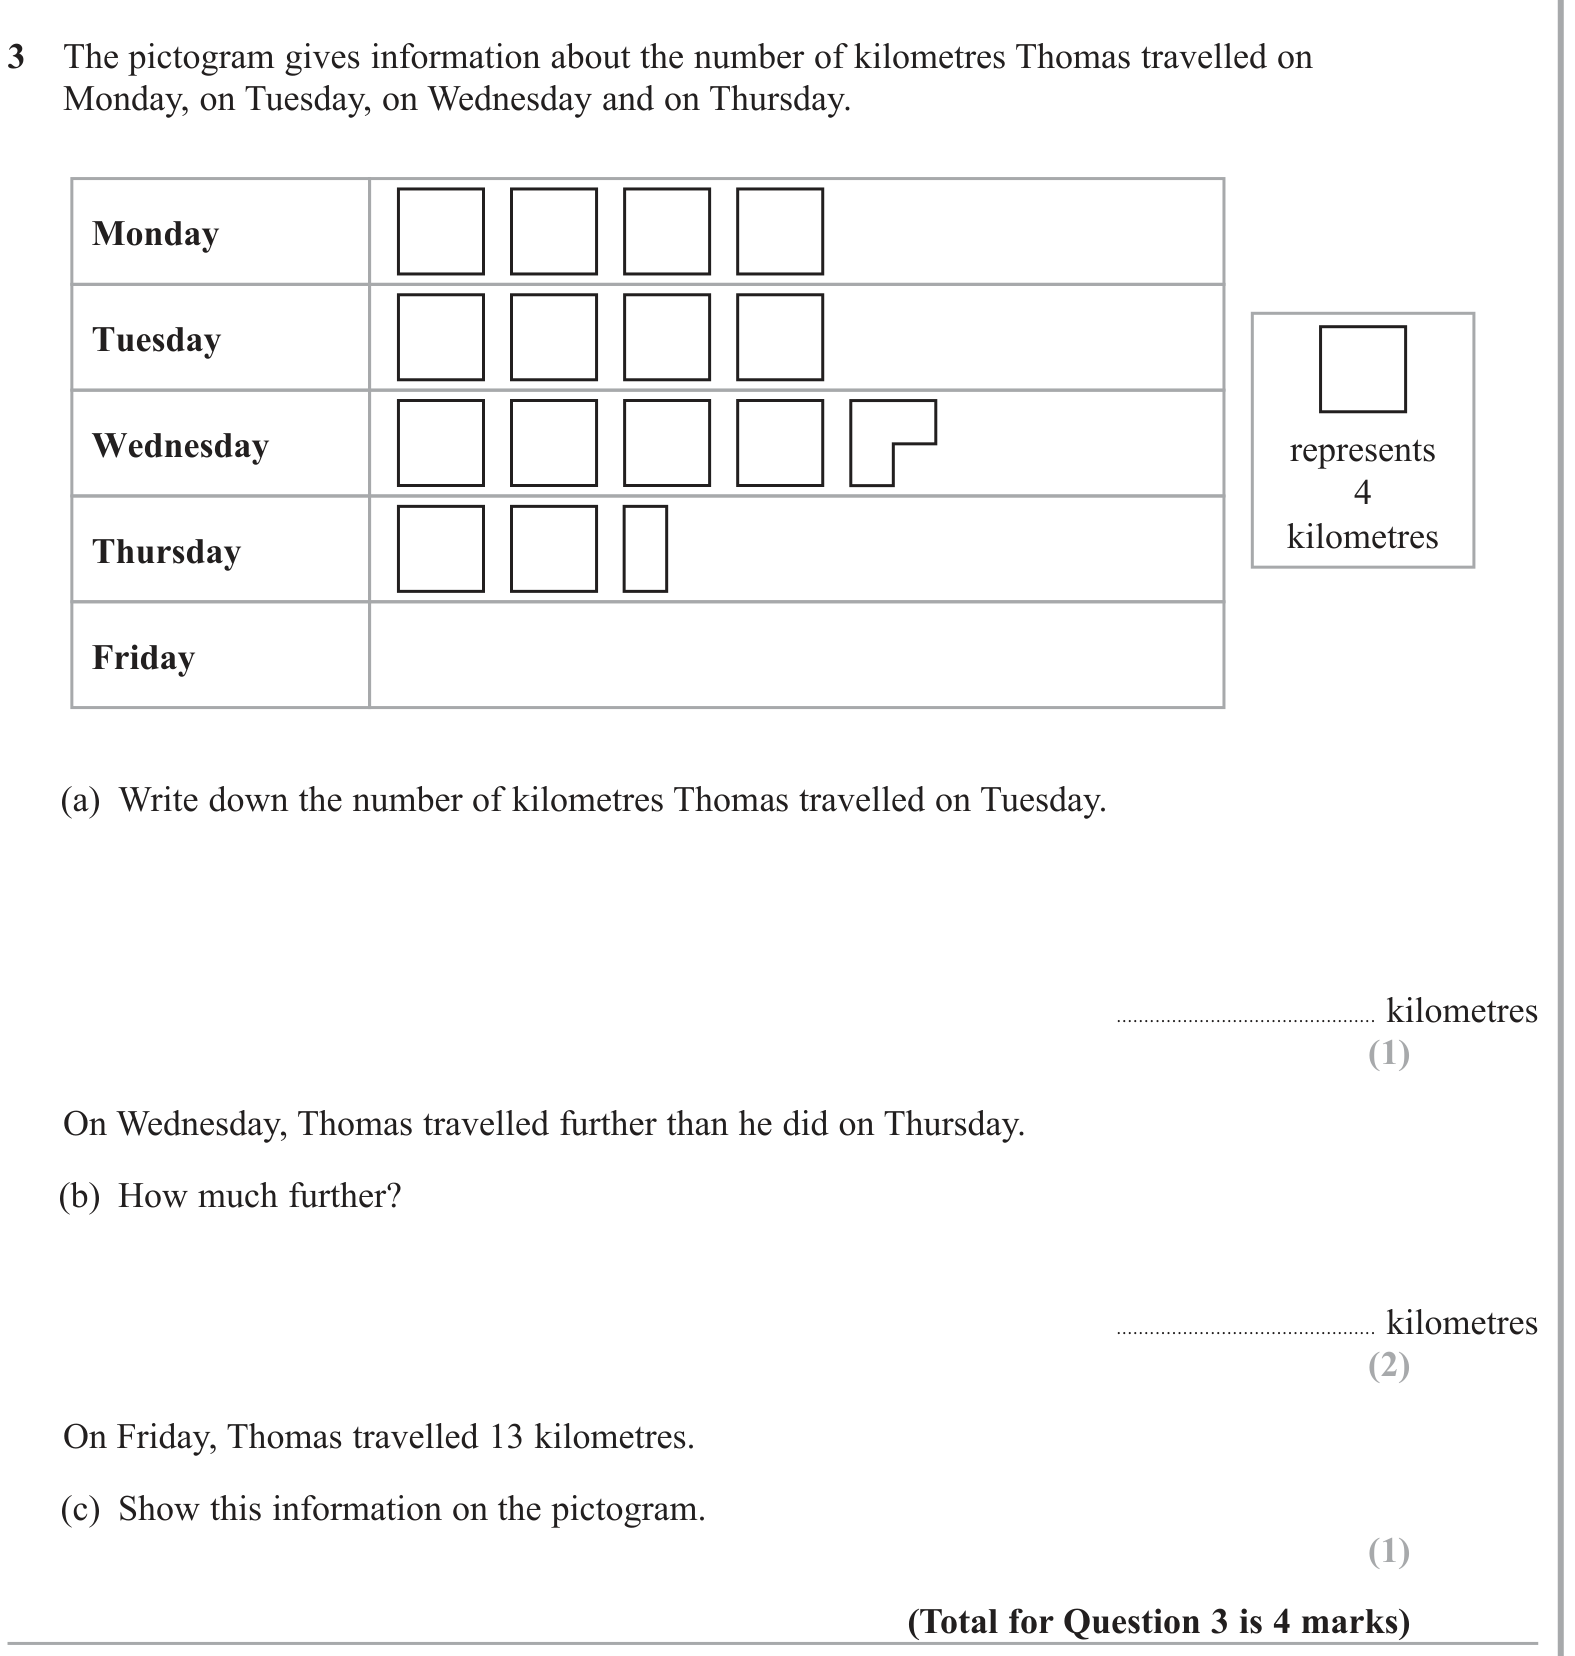
Show mark scheme

Question 5 of 19
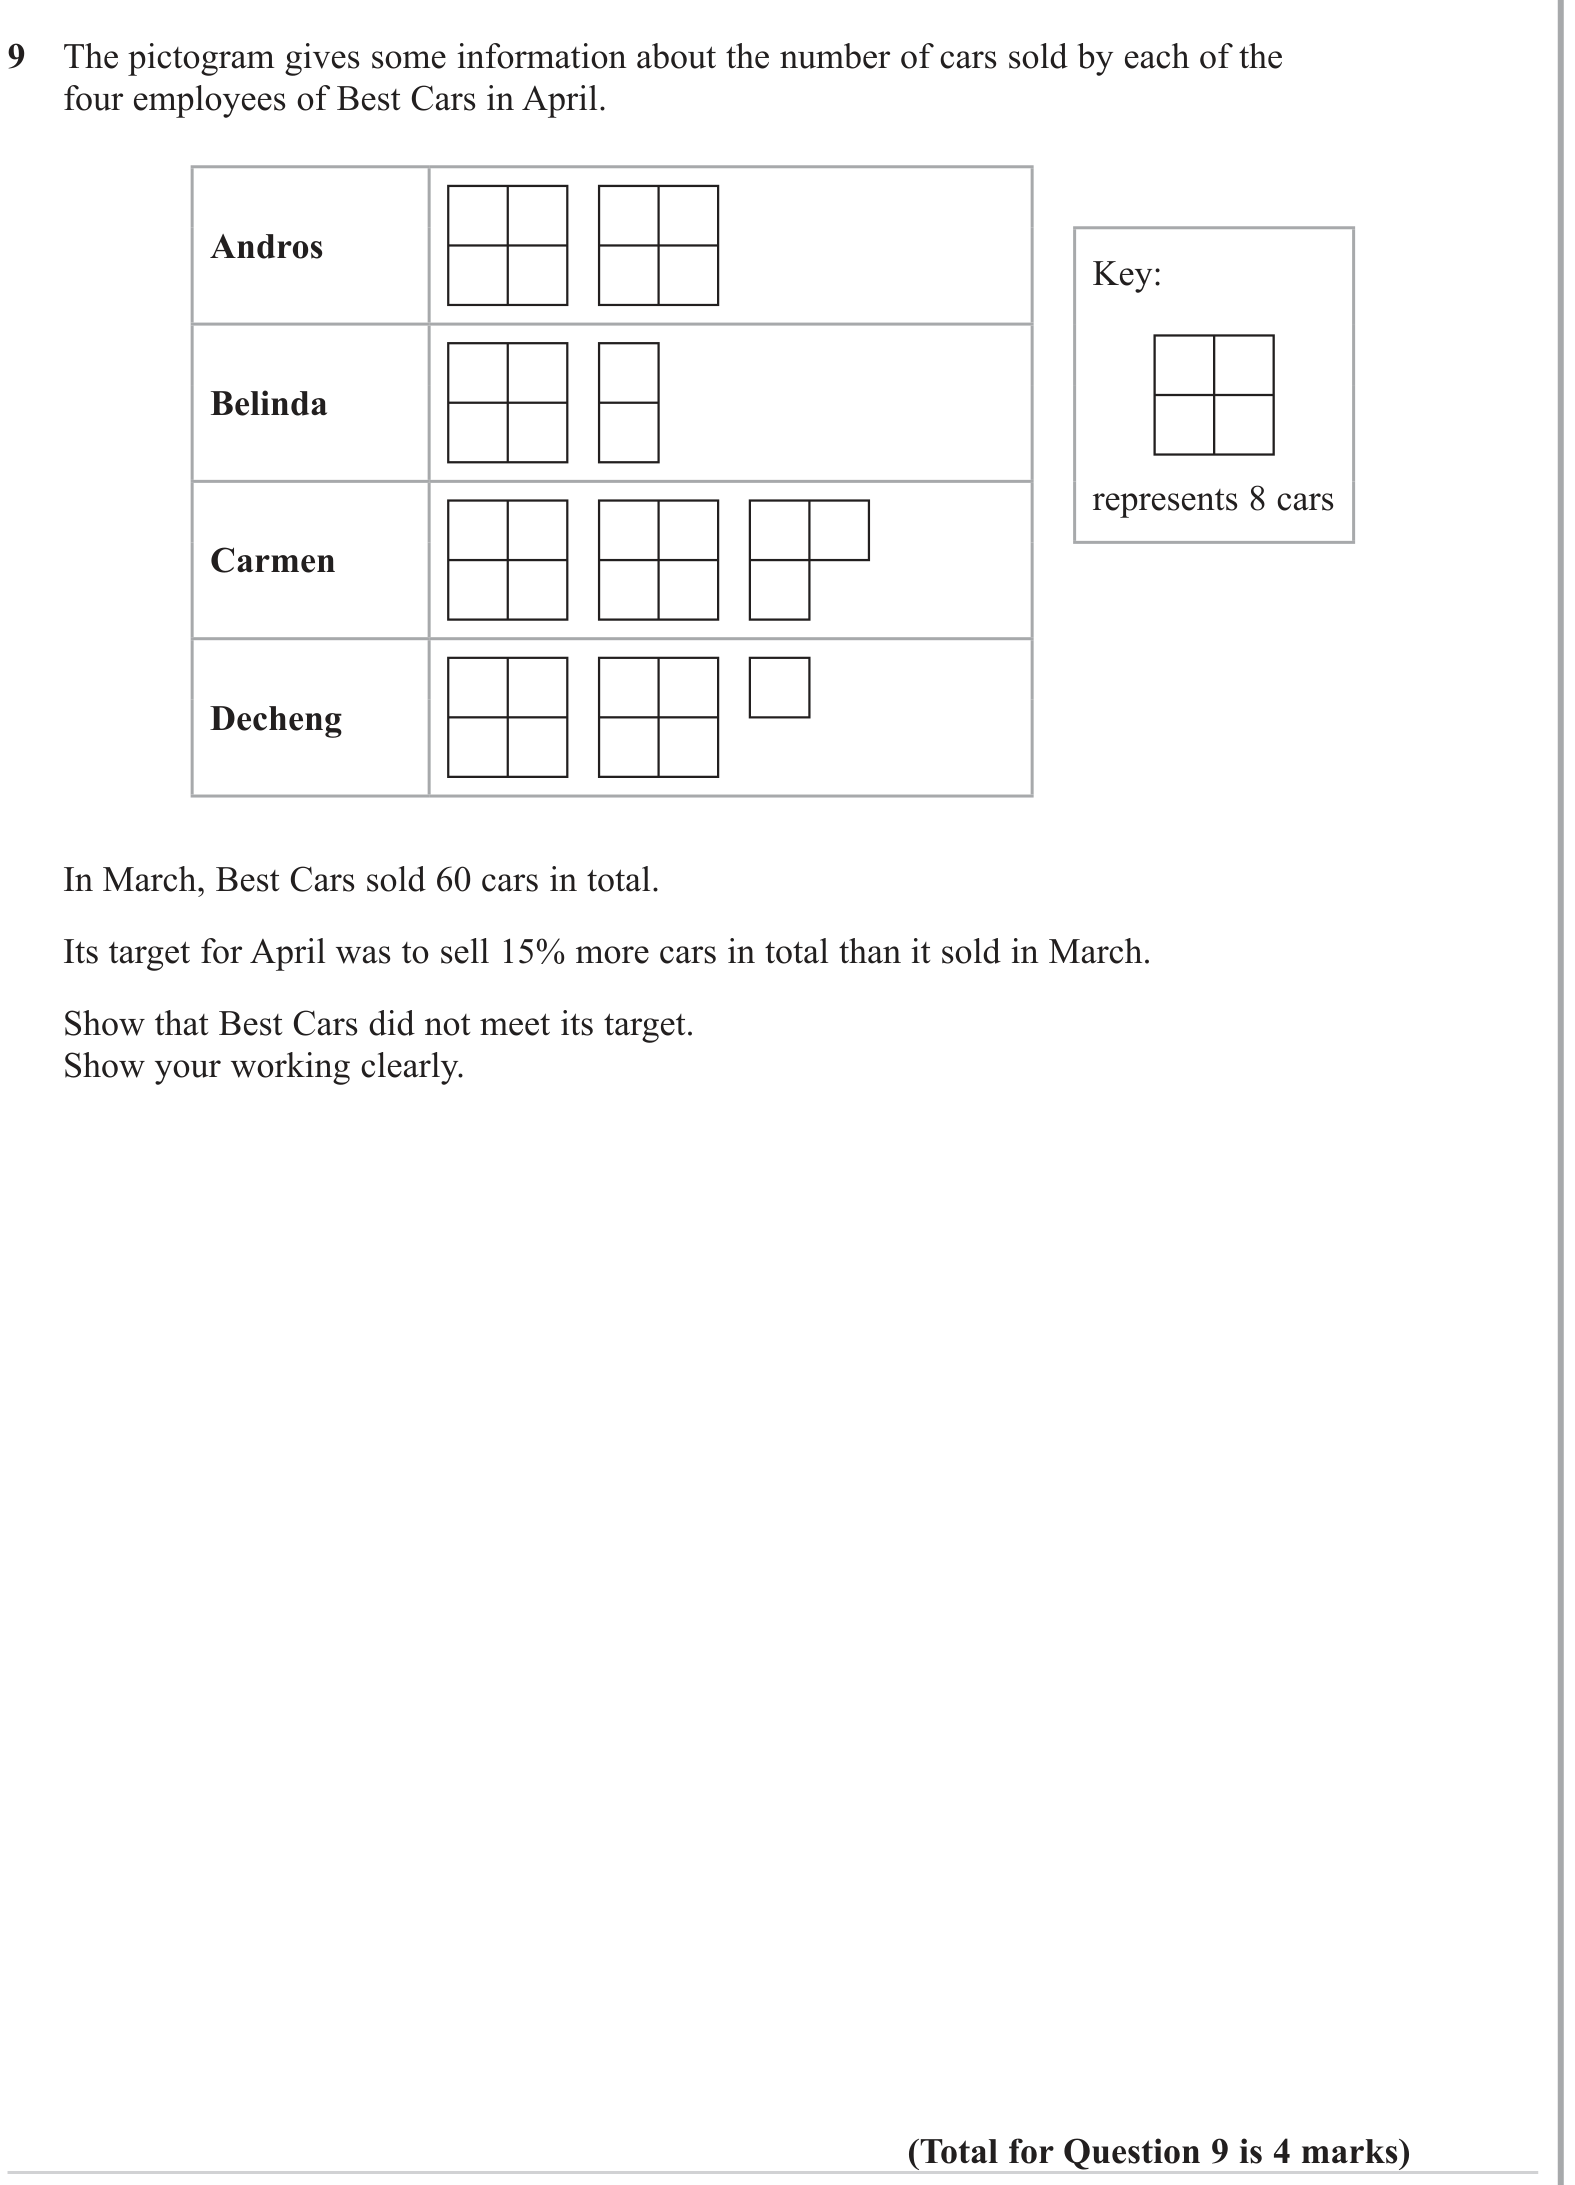
Show mark scheme

Question 6 of 19
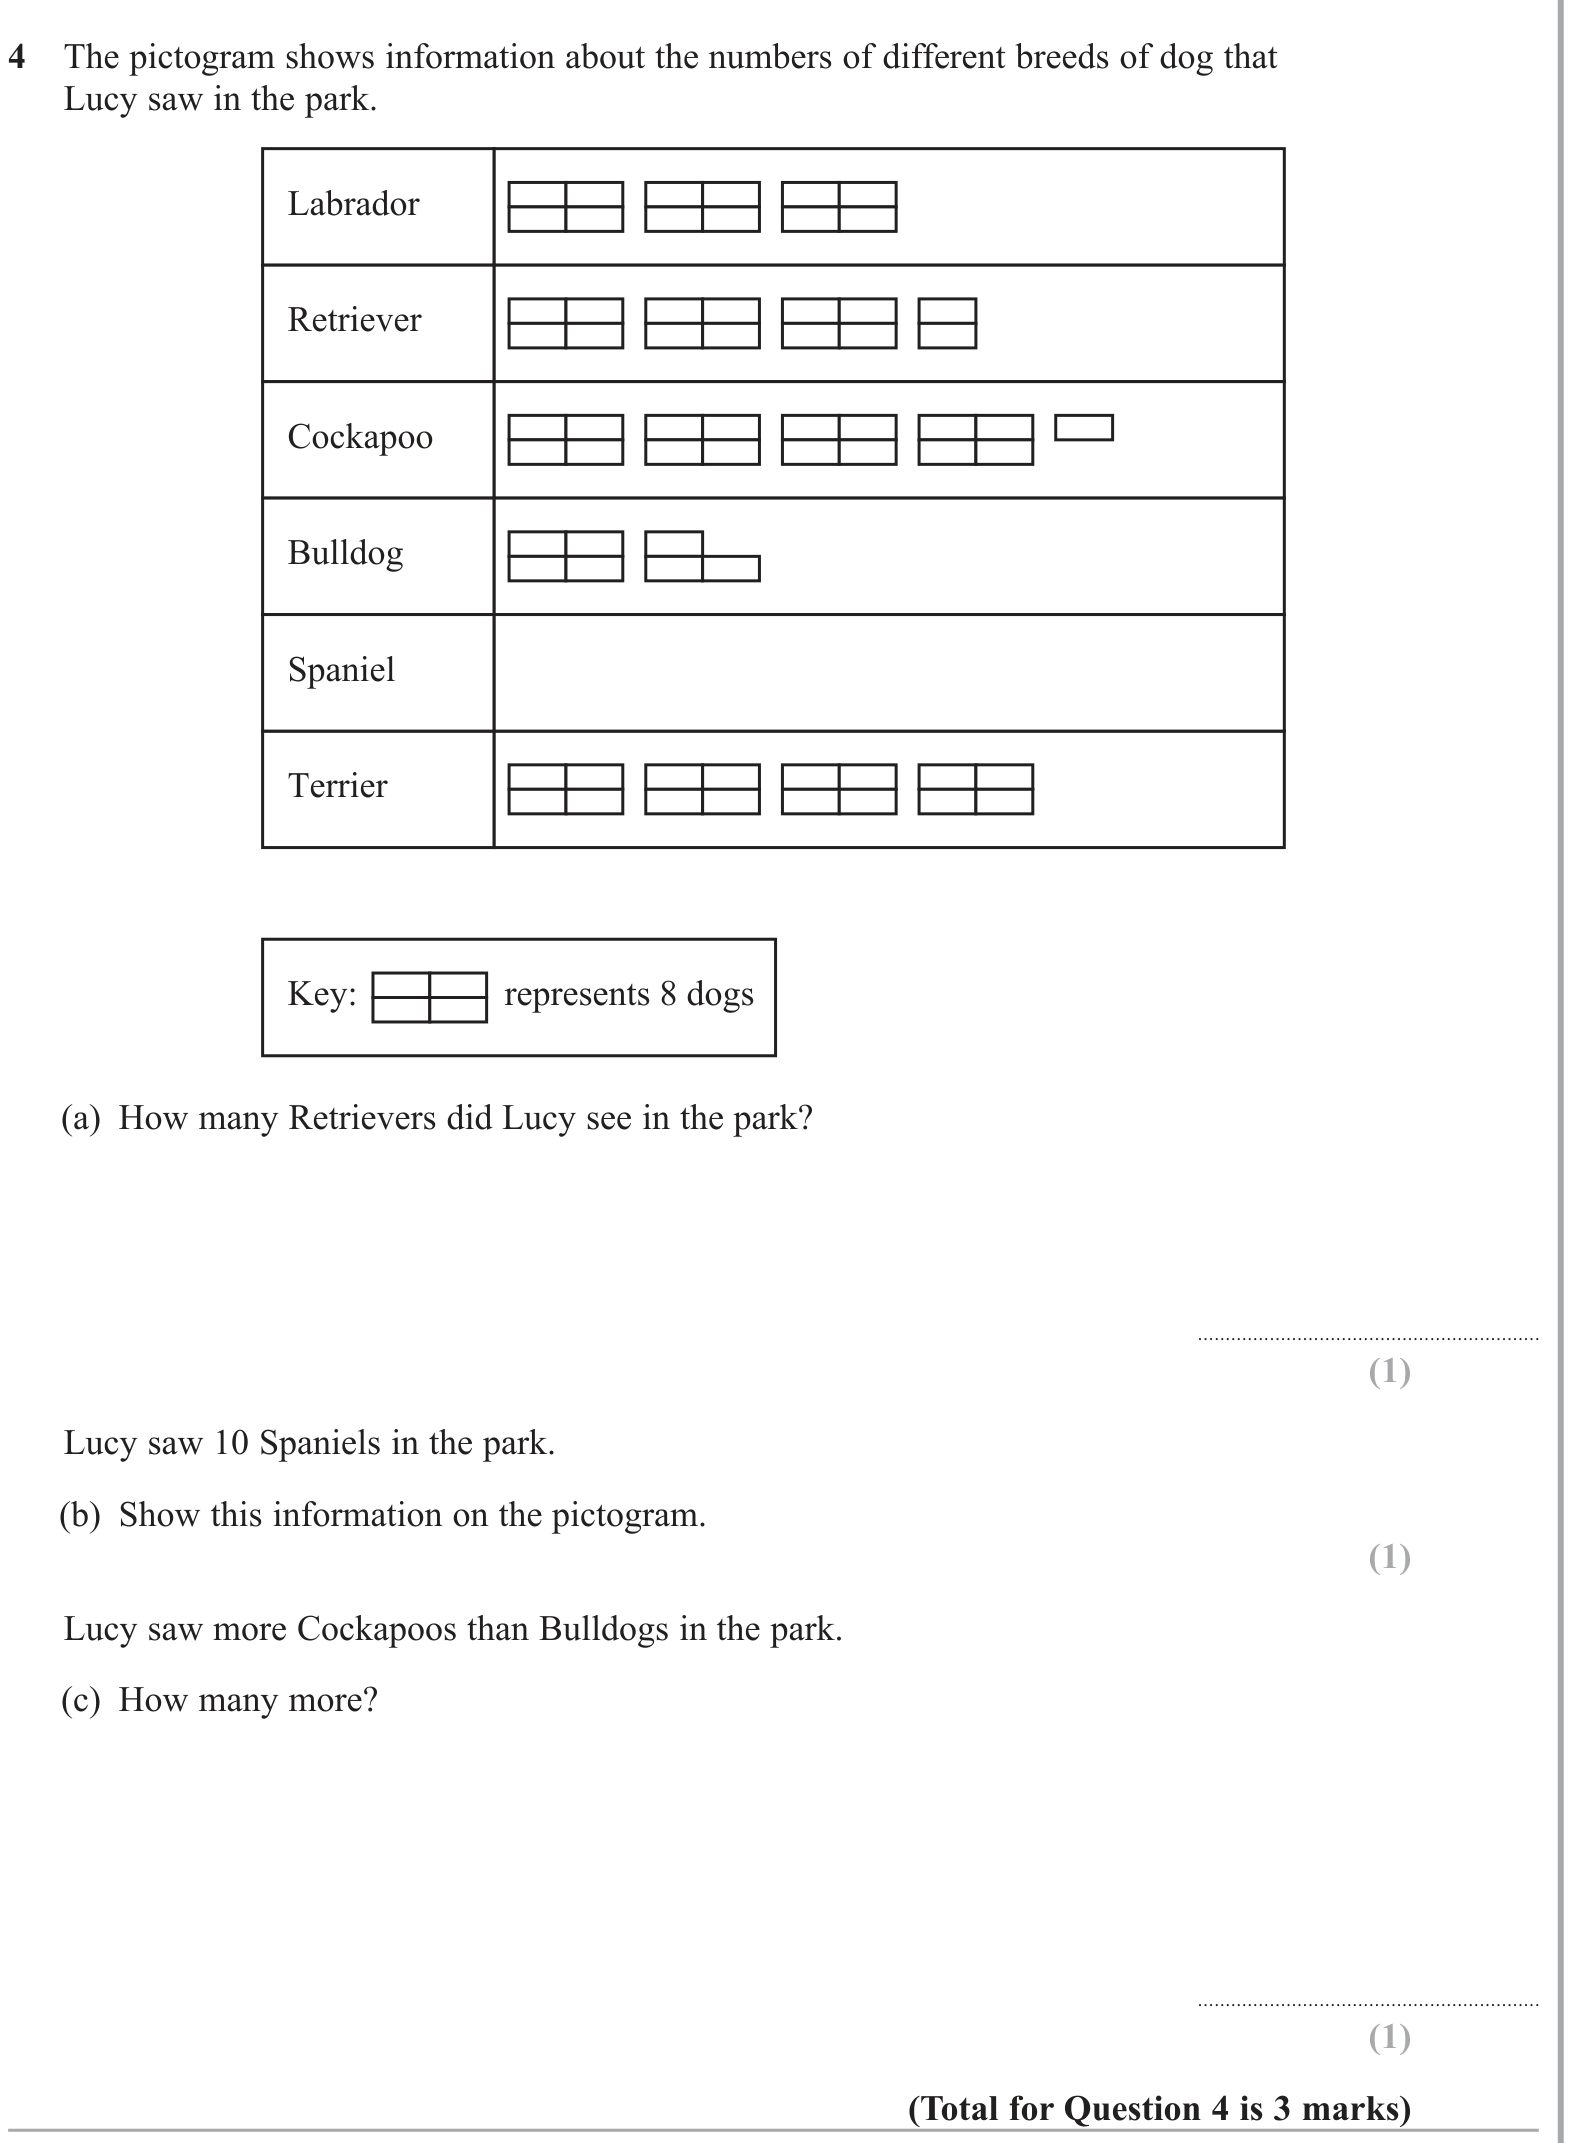
Show mark scheme

Question 7 of 19
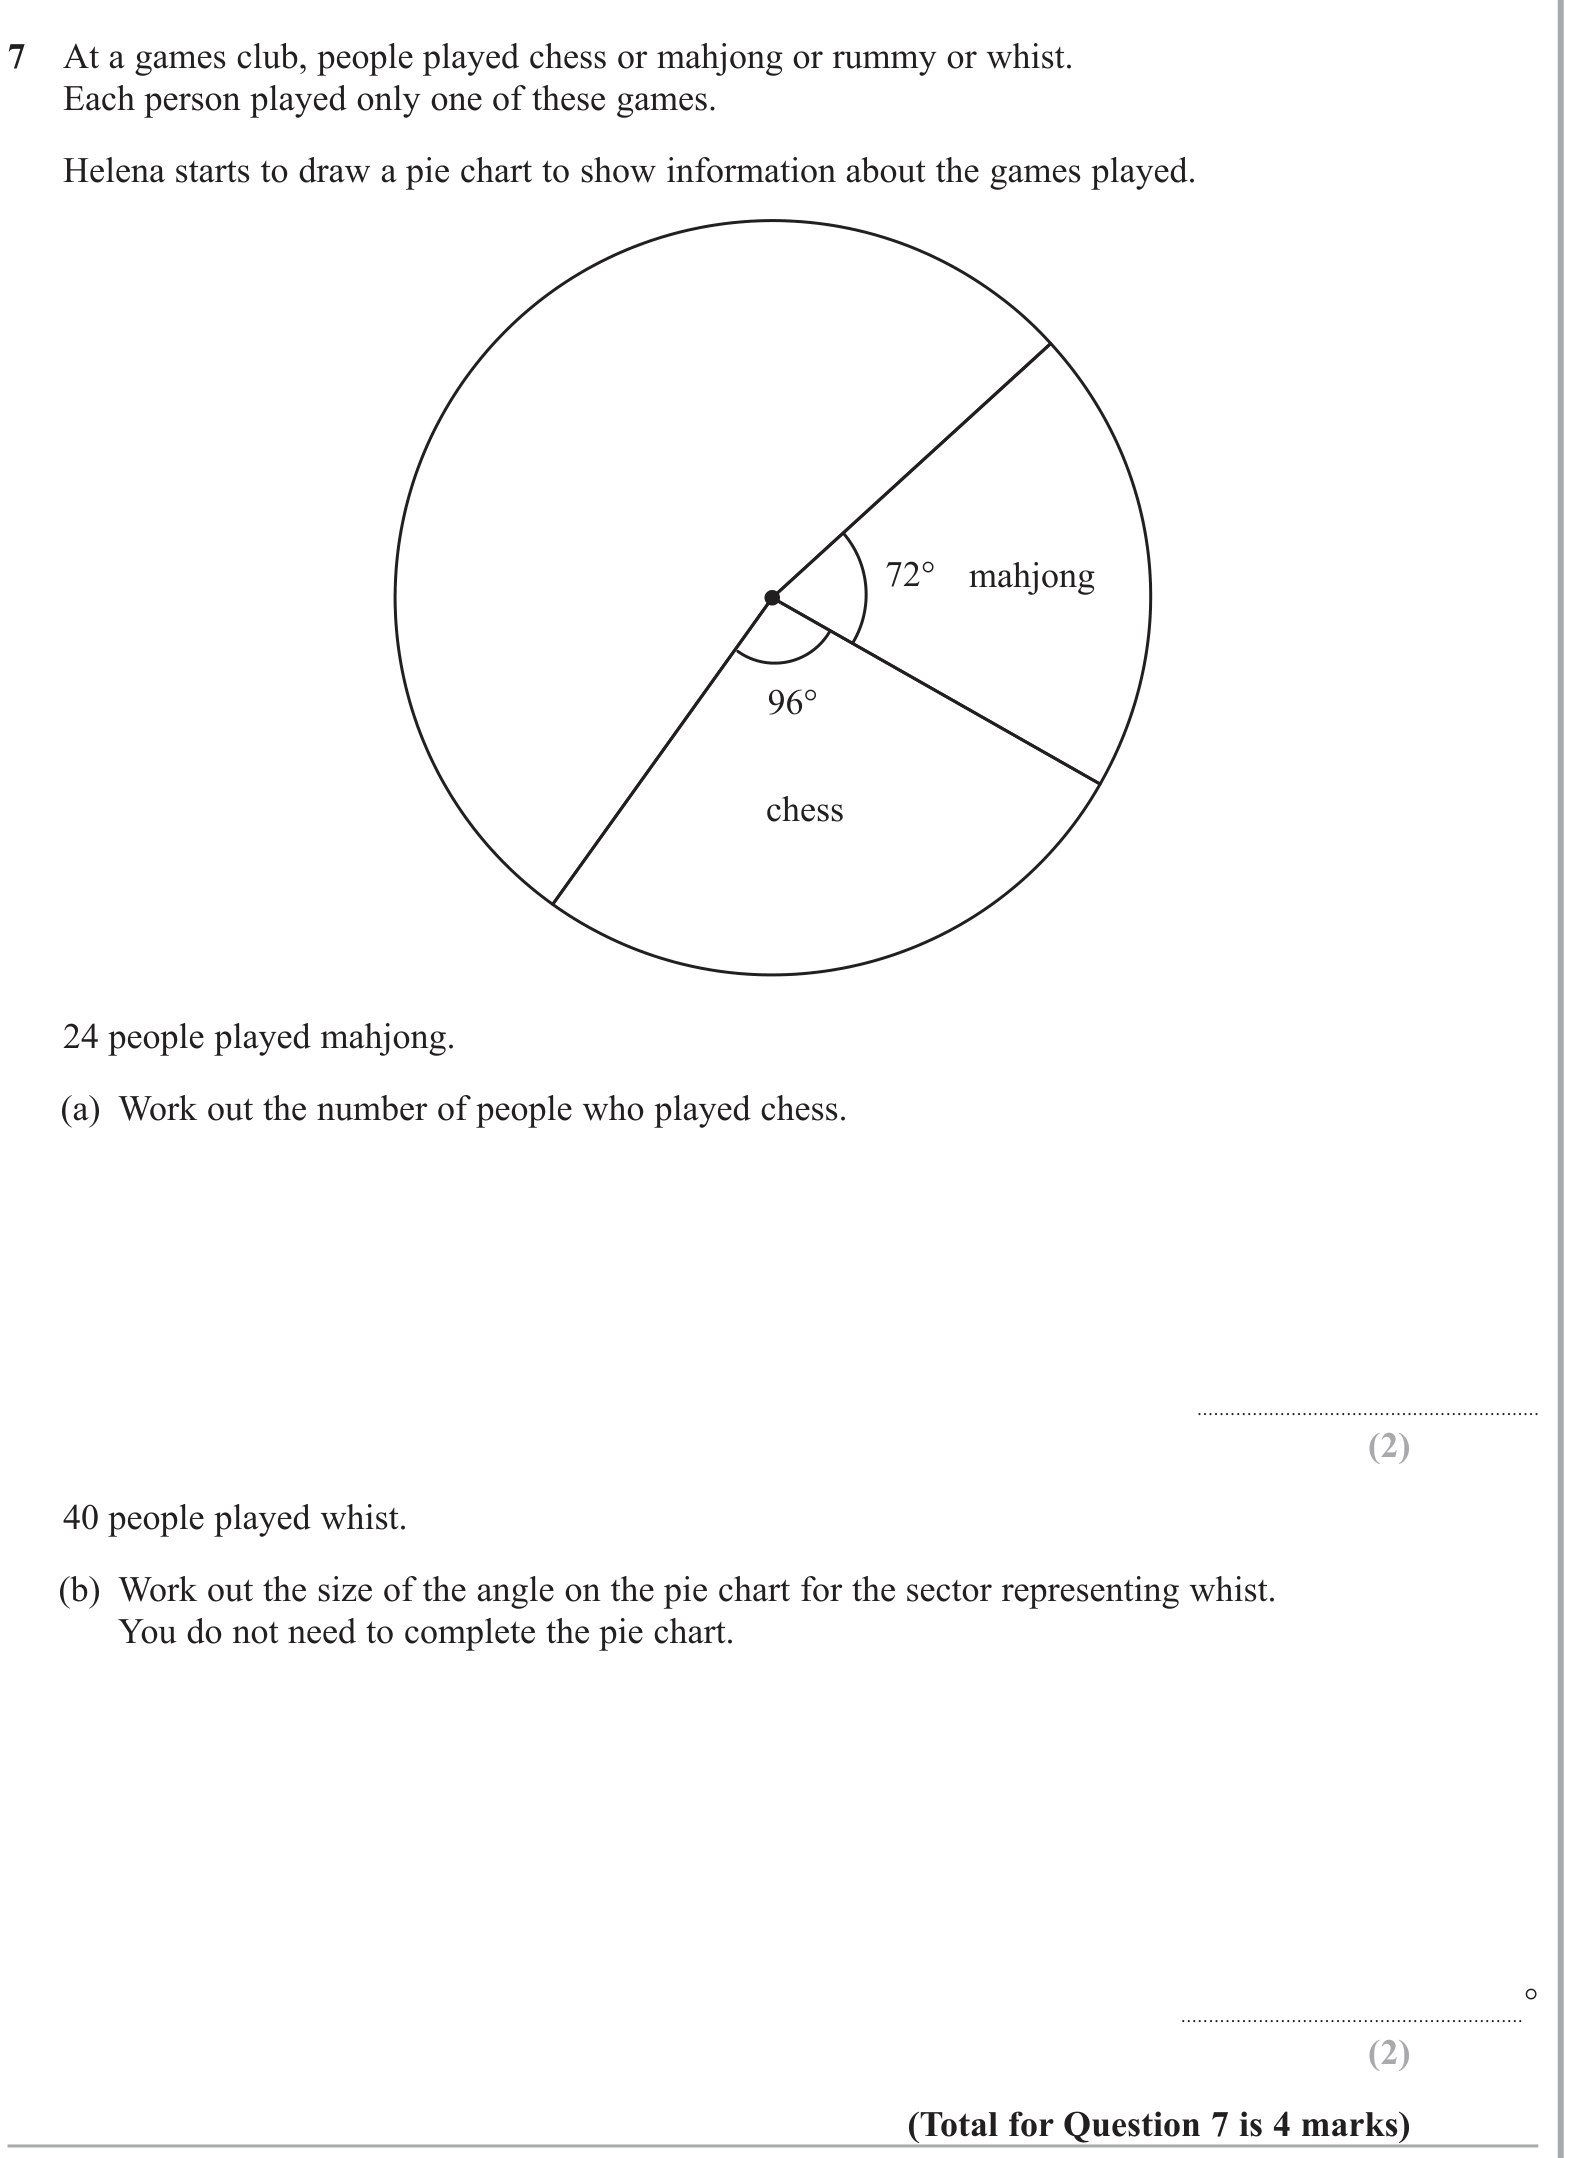
Show mark scheme

Question 8 of 19
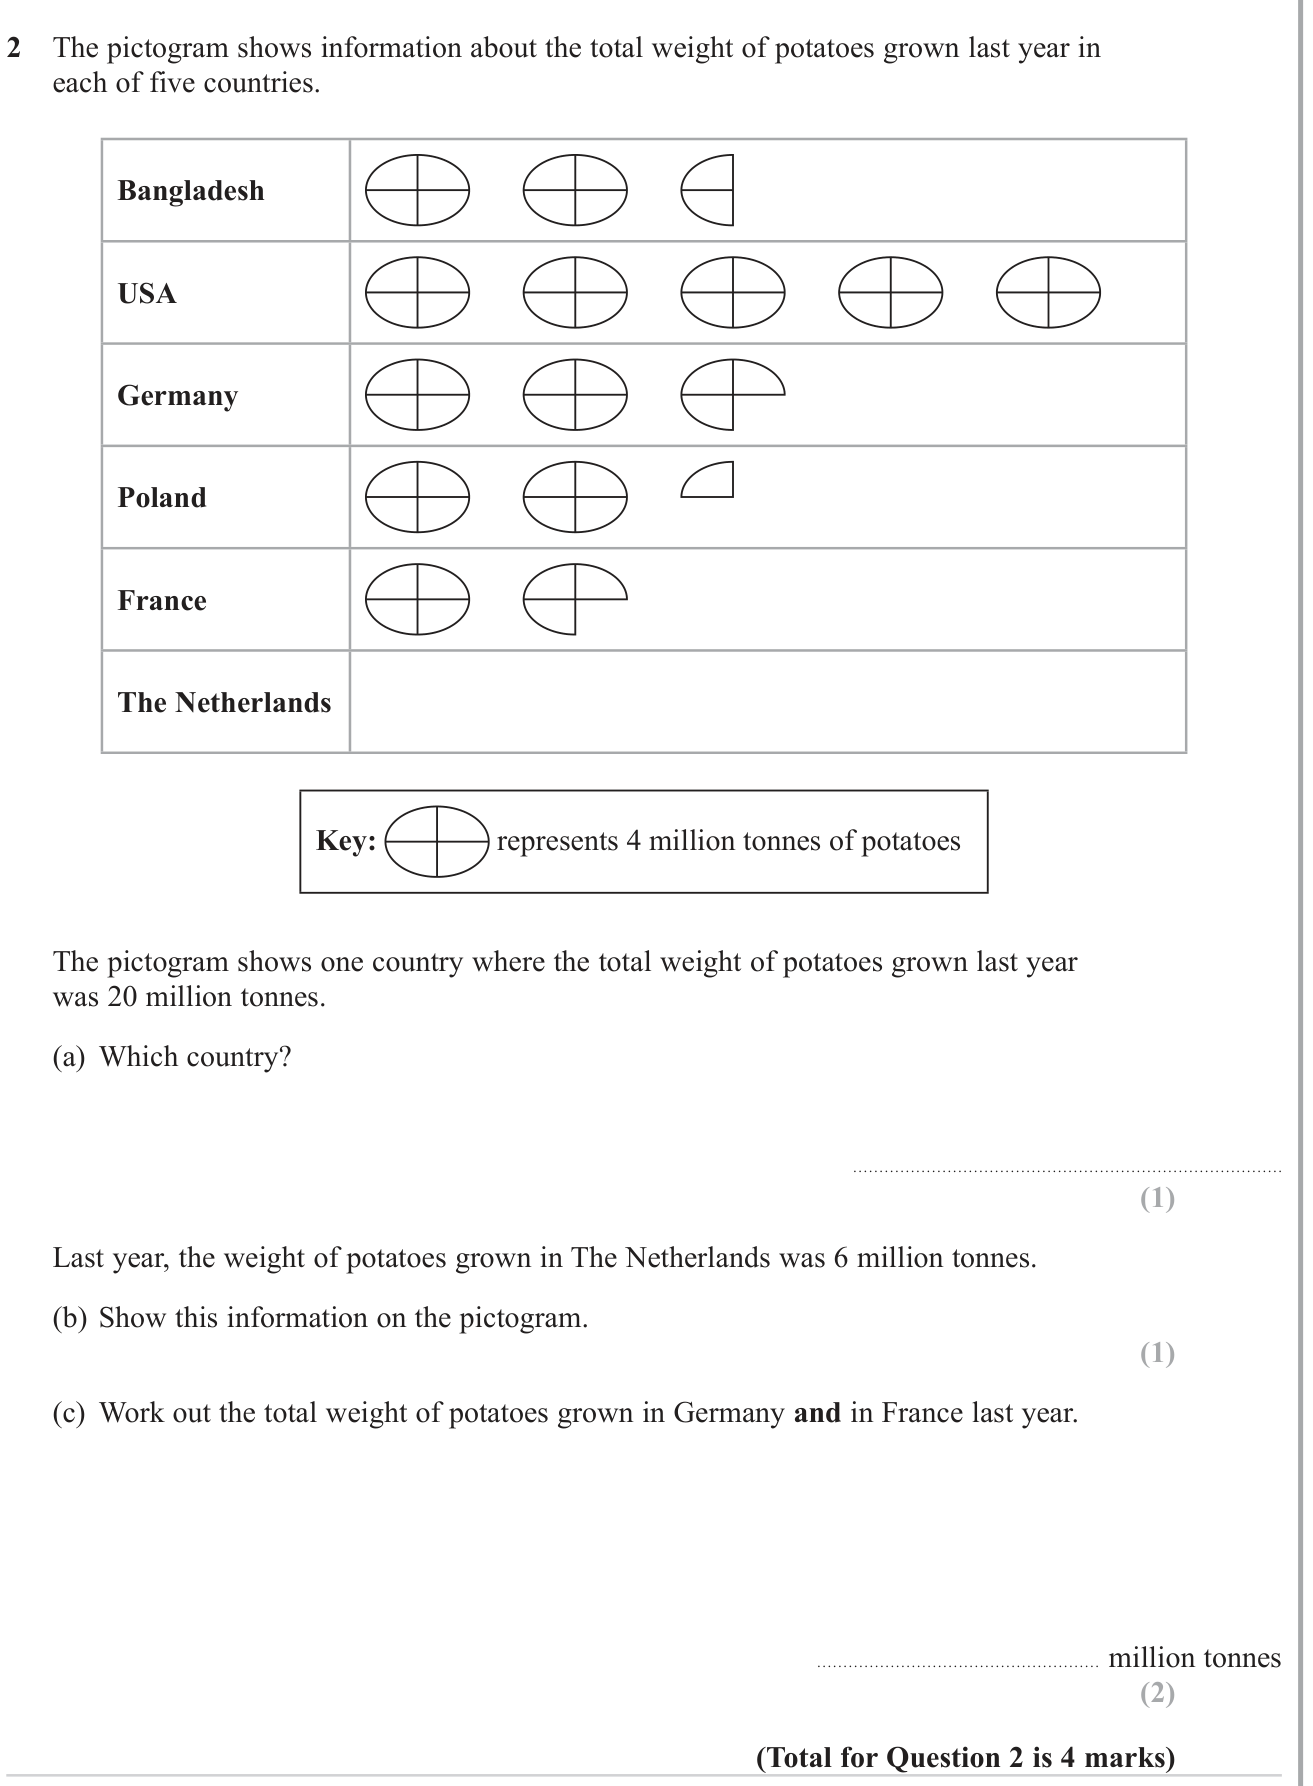
Show mark scheme

Question 9 of 19
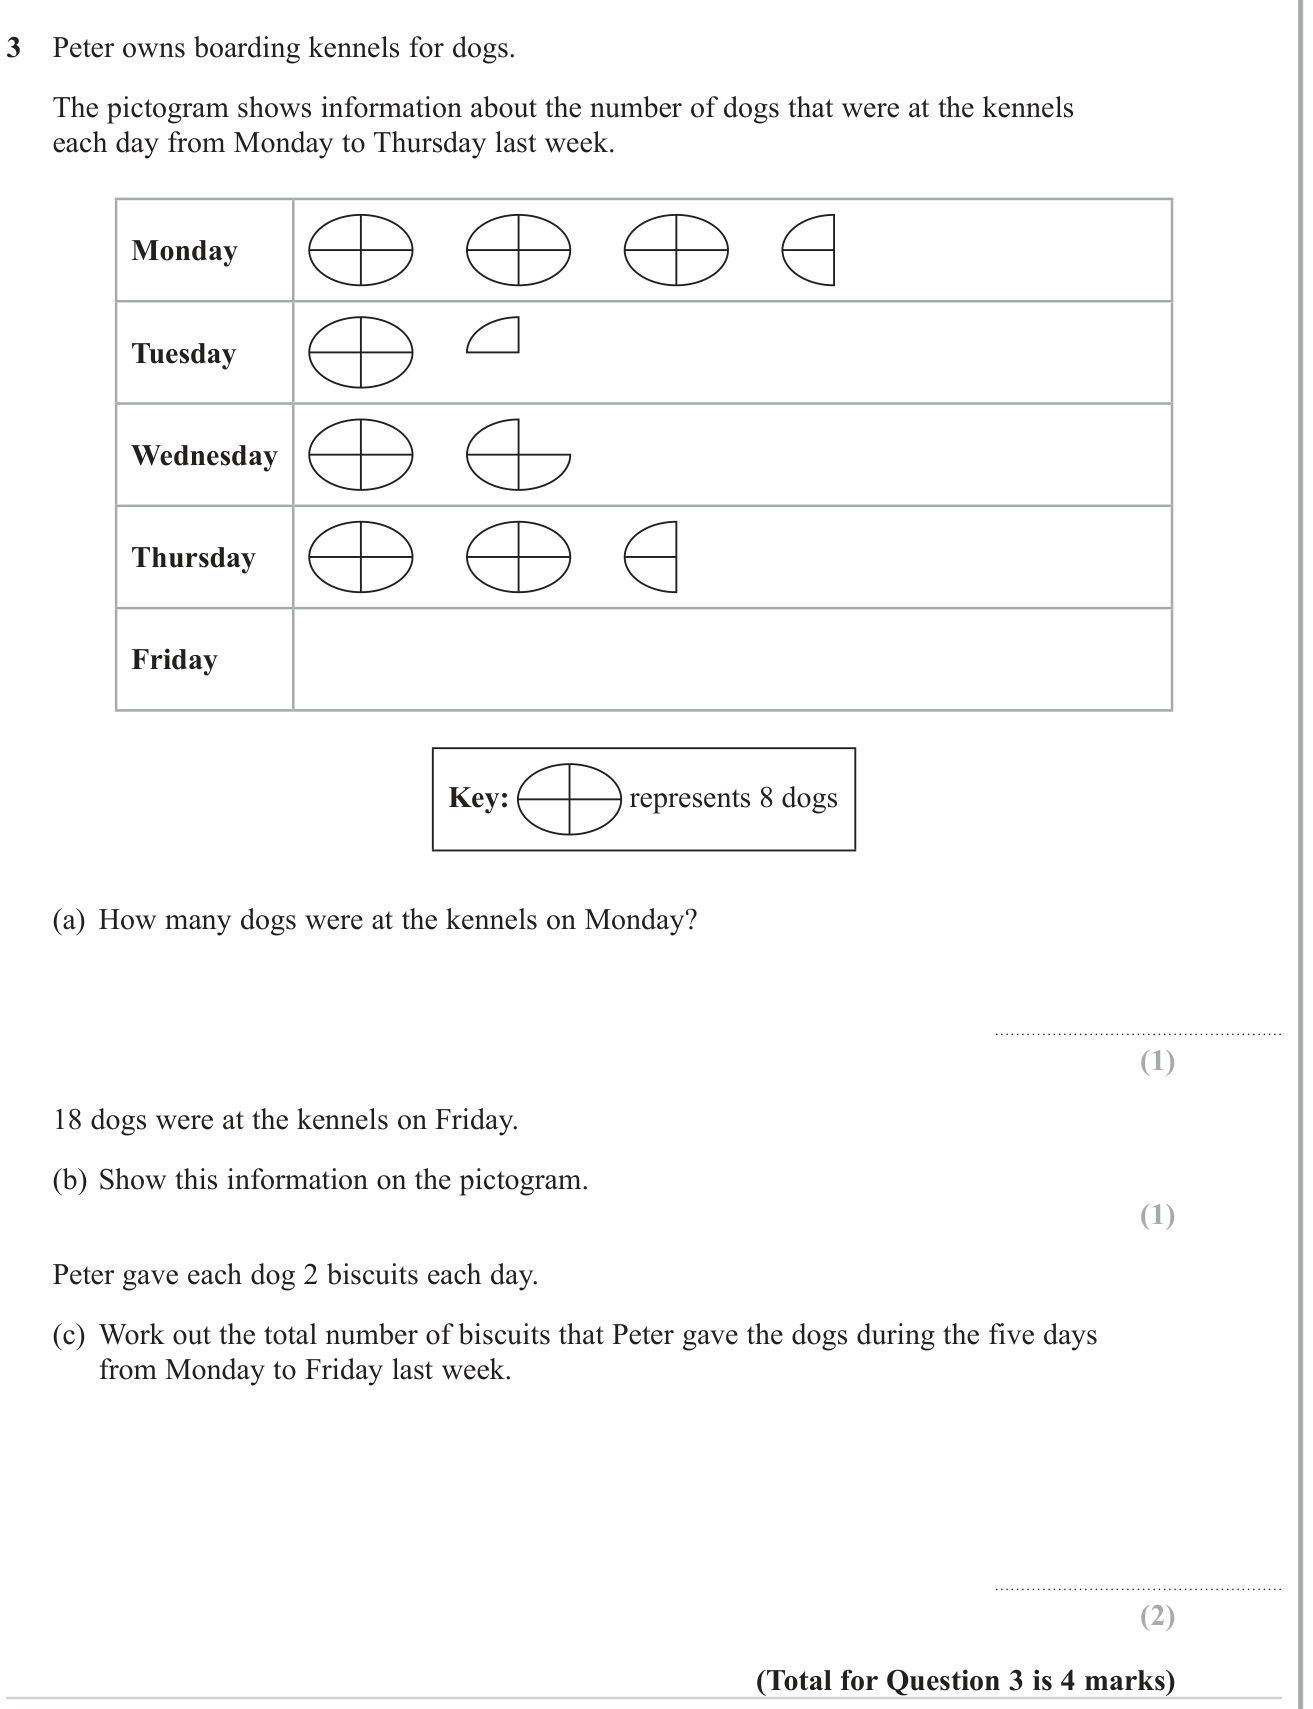
Show mark scheme

Question 10 of 19
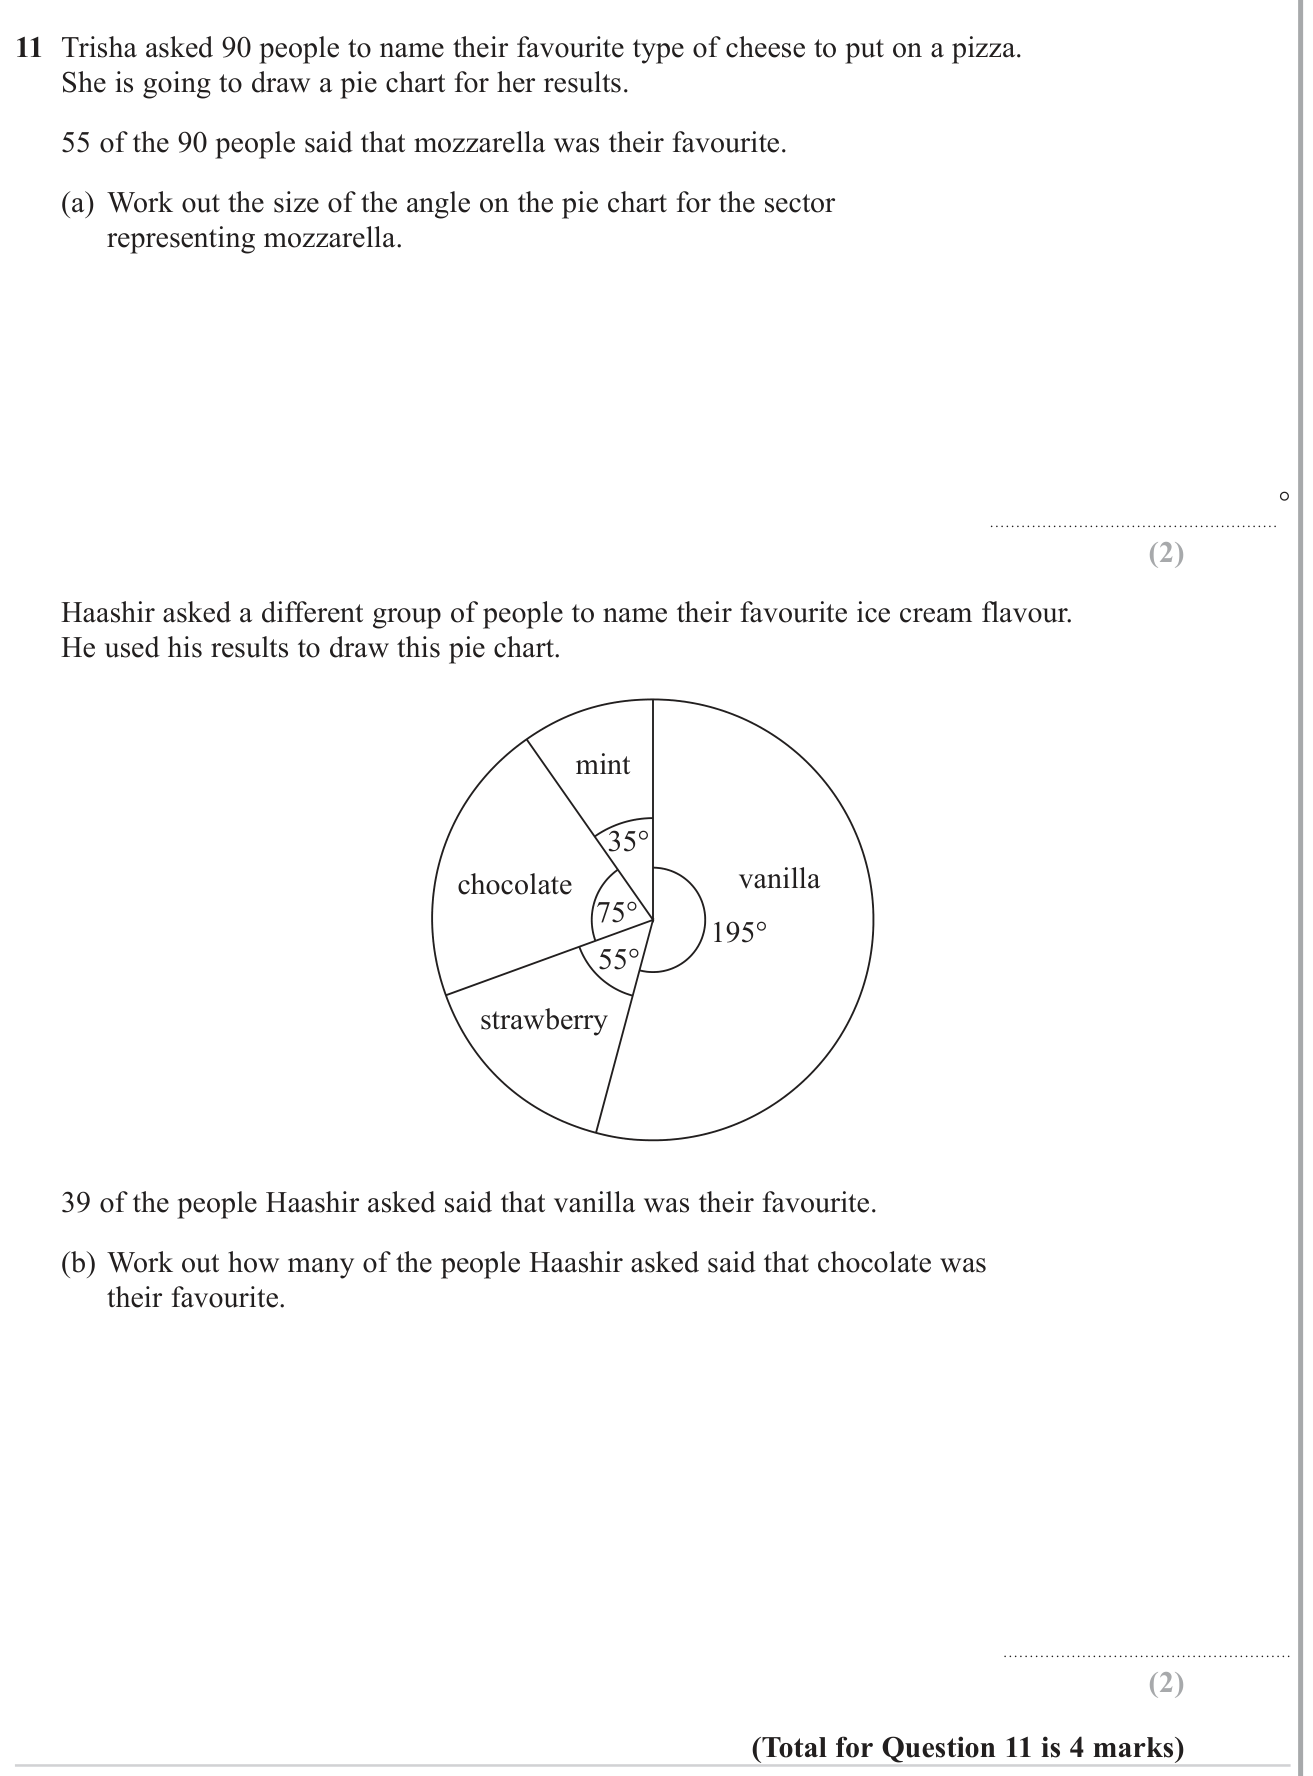
Show mark scheme

Question 11 of 19
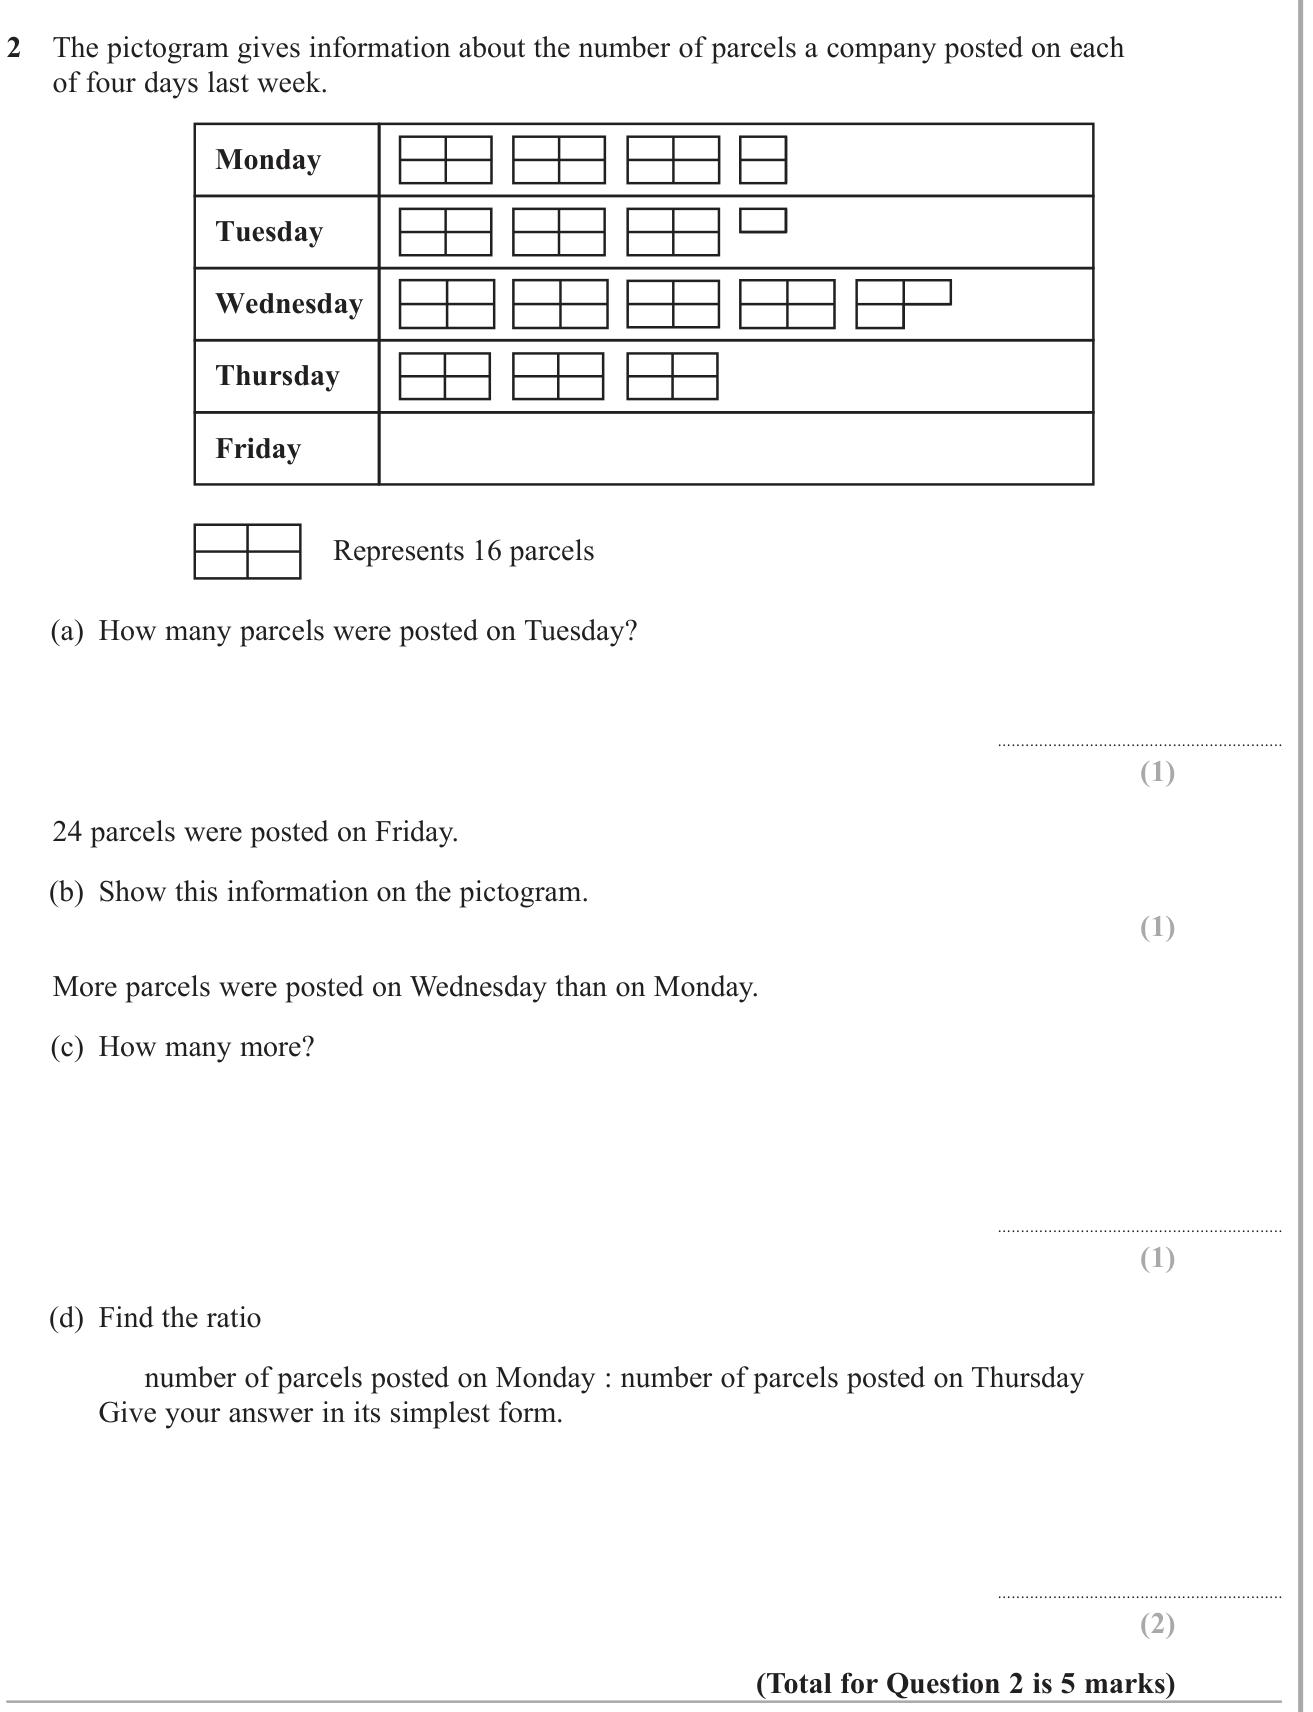
Show mark scheme

Question 12 of 19
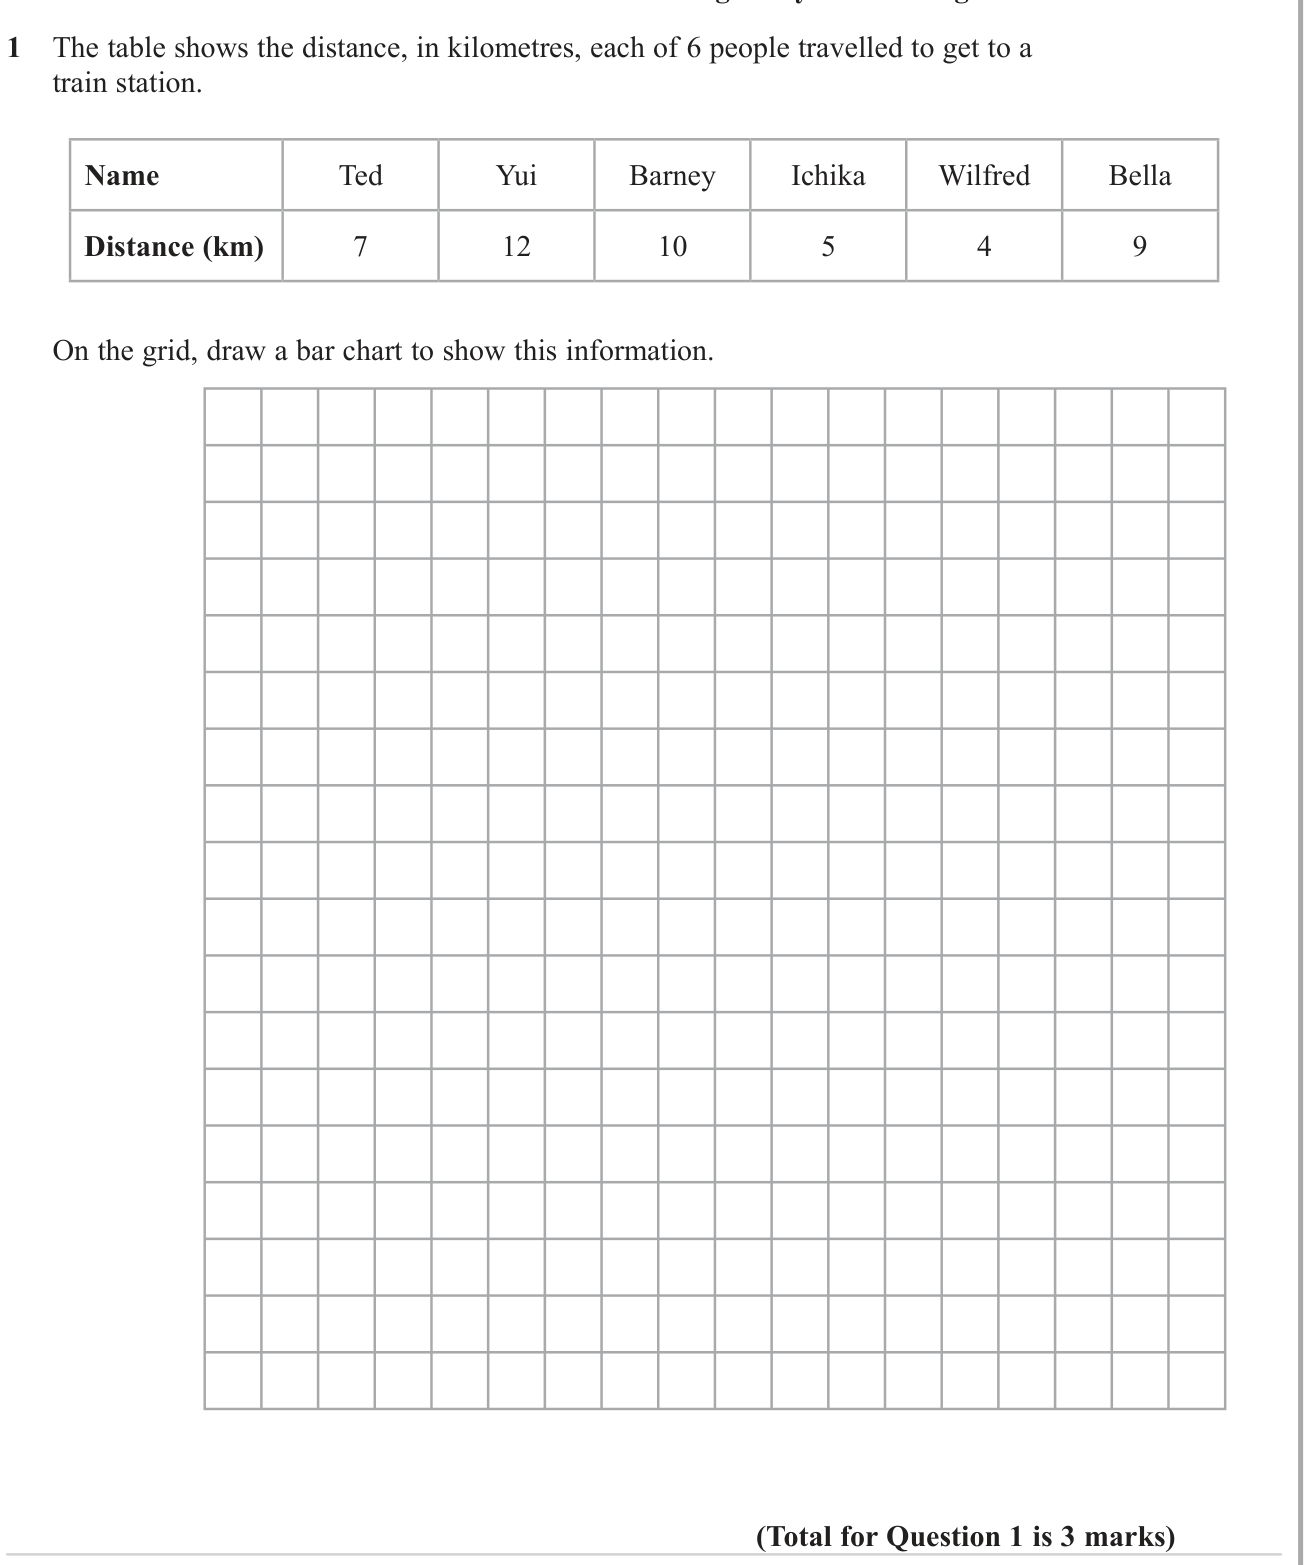
Show mark scheme

Question 13 of 19
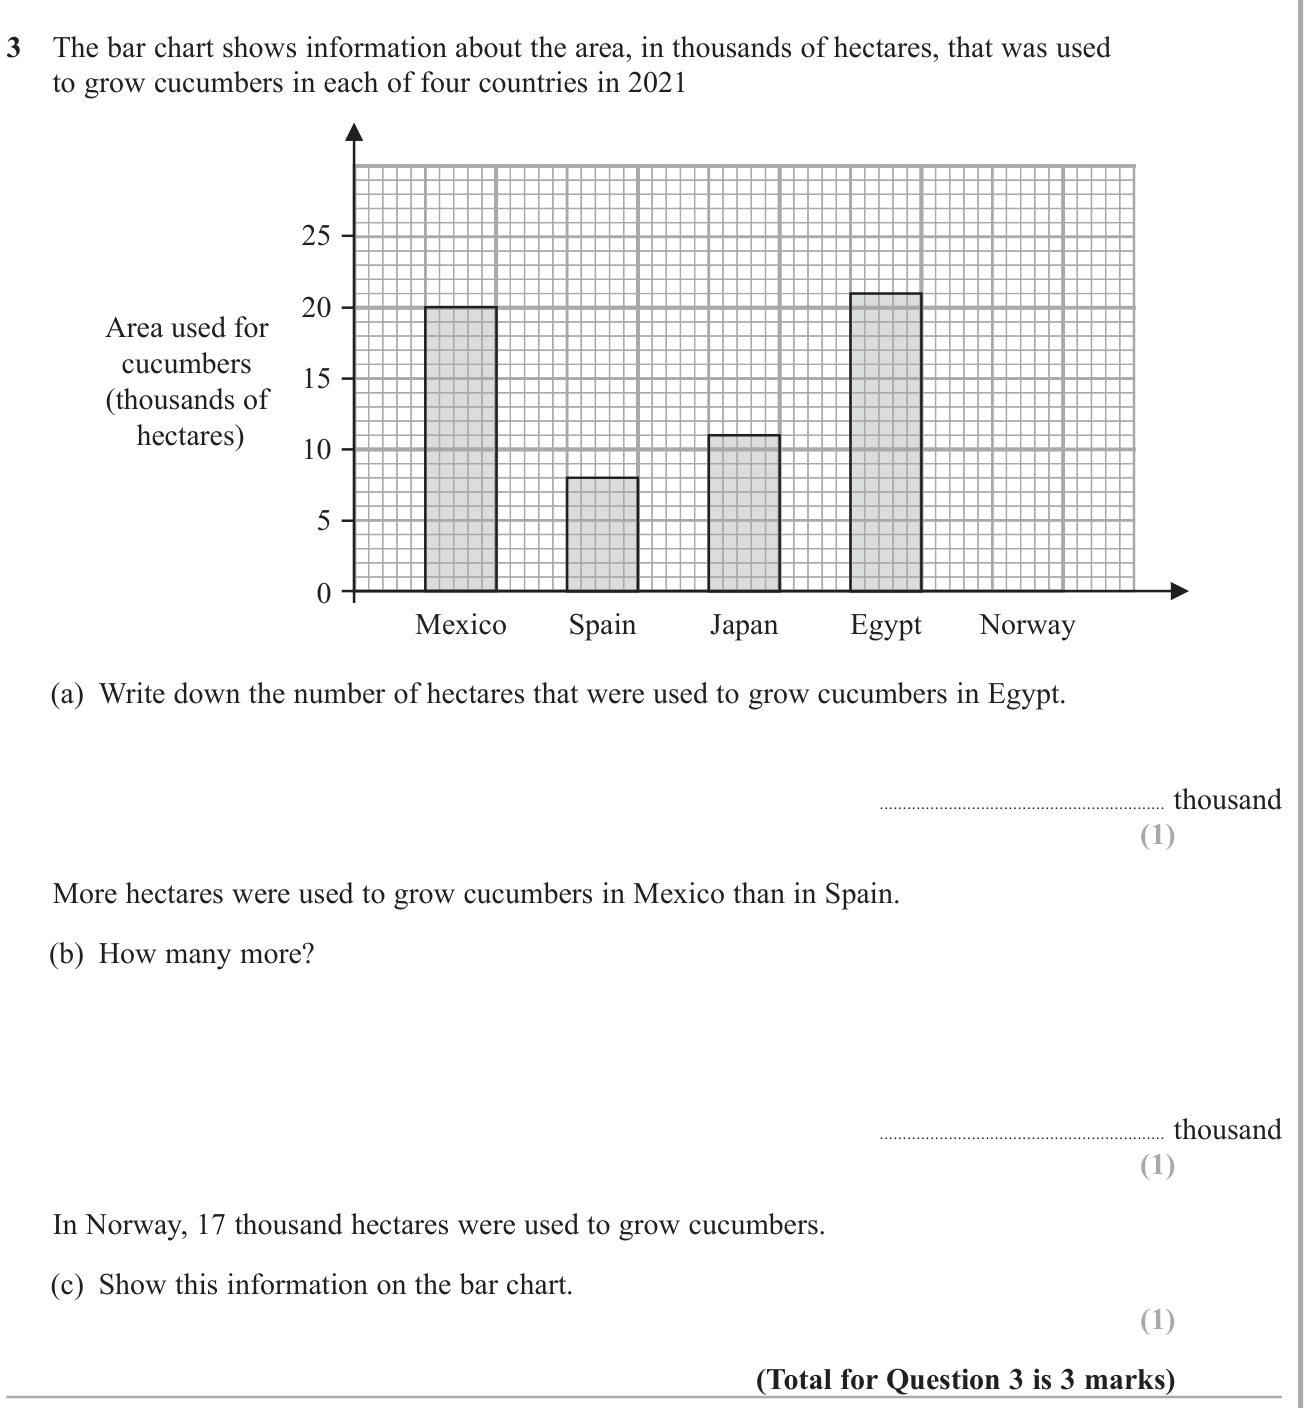
Show mark scheme

Question 14 of 19
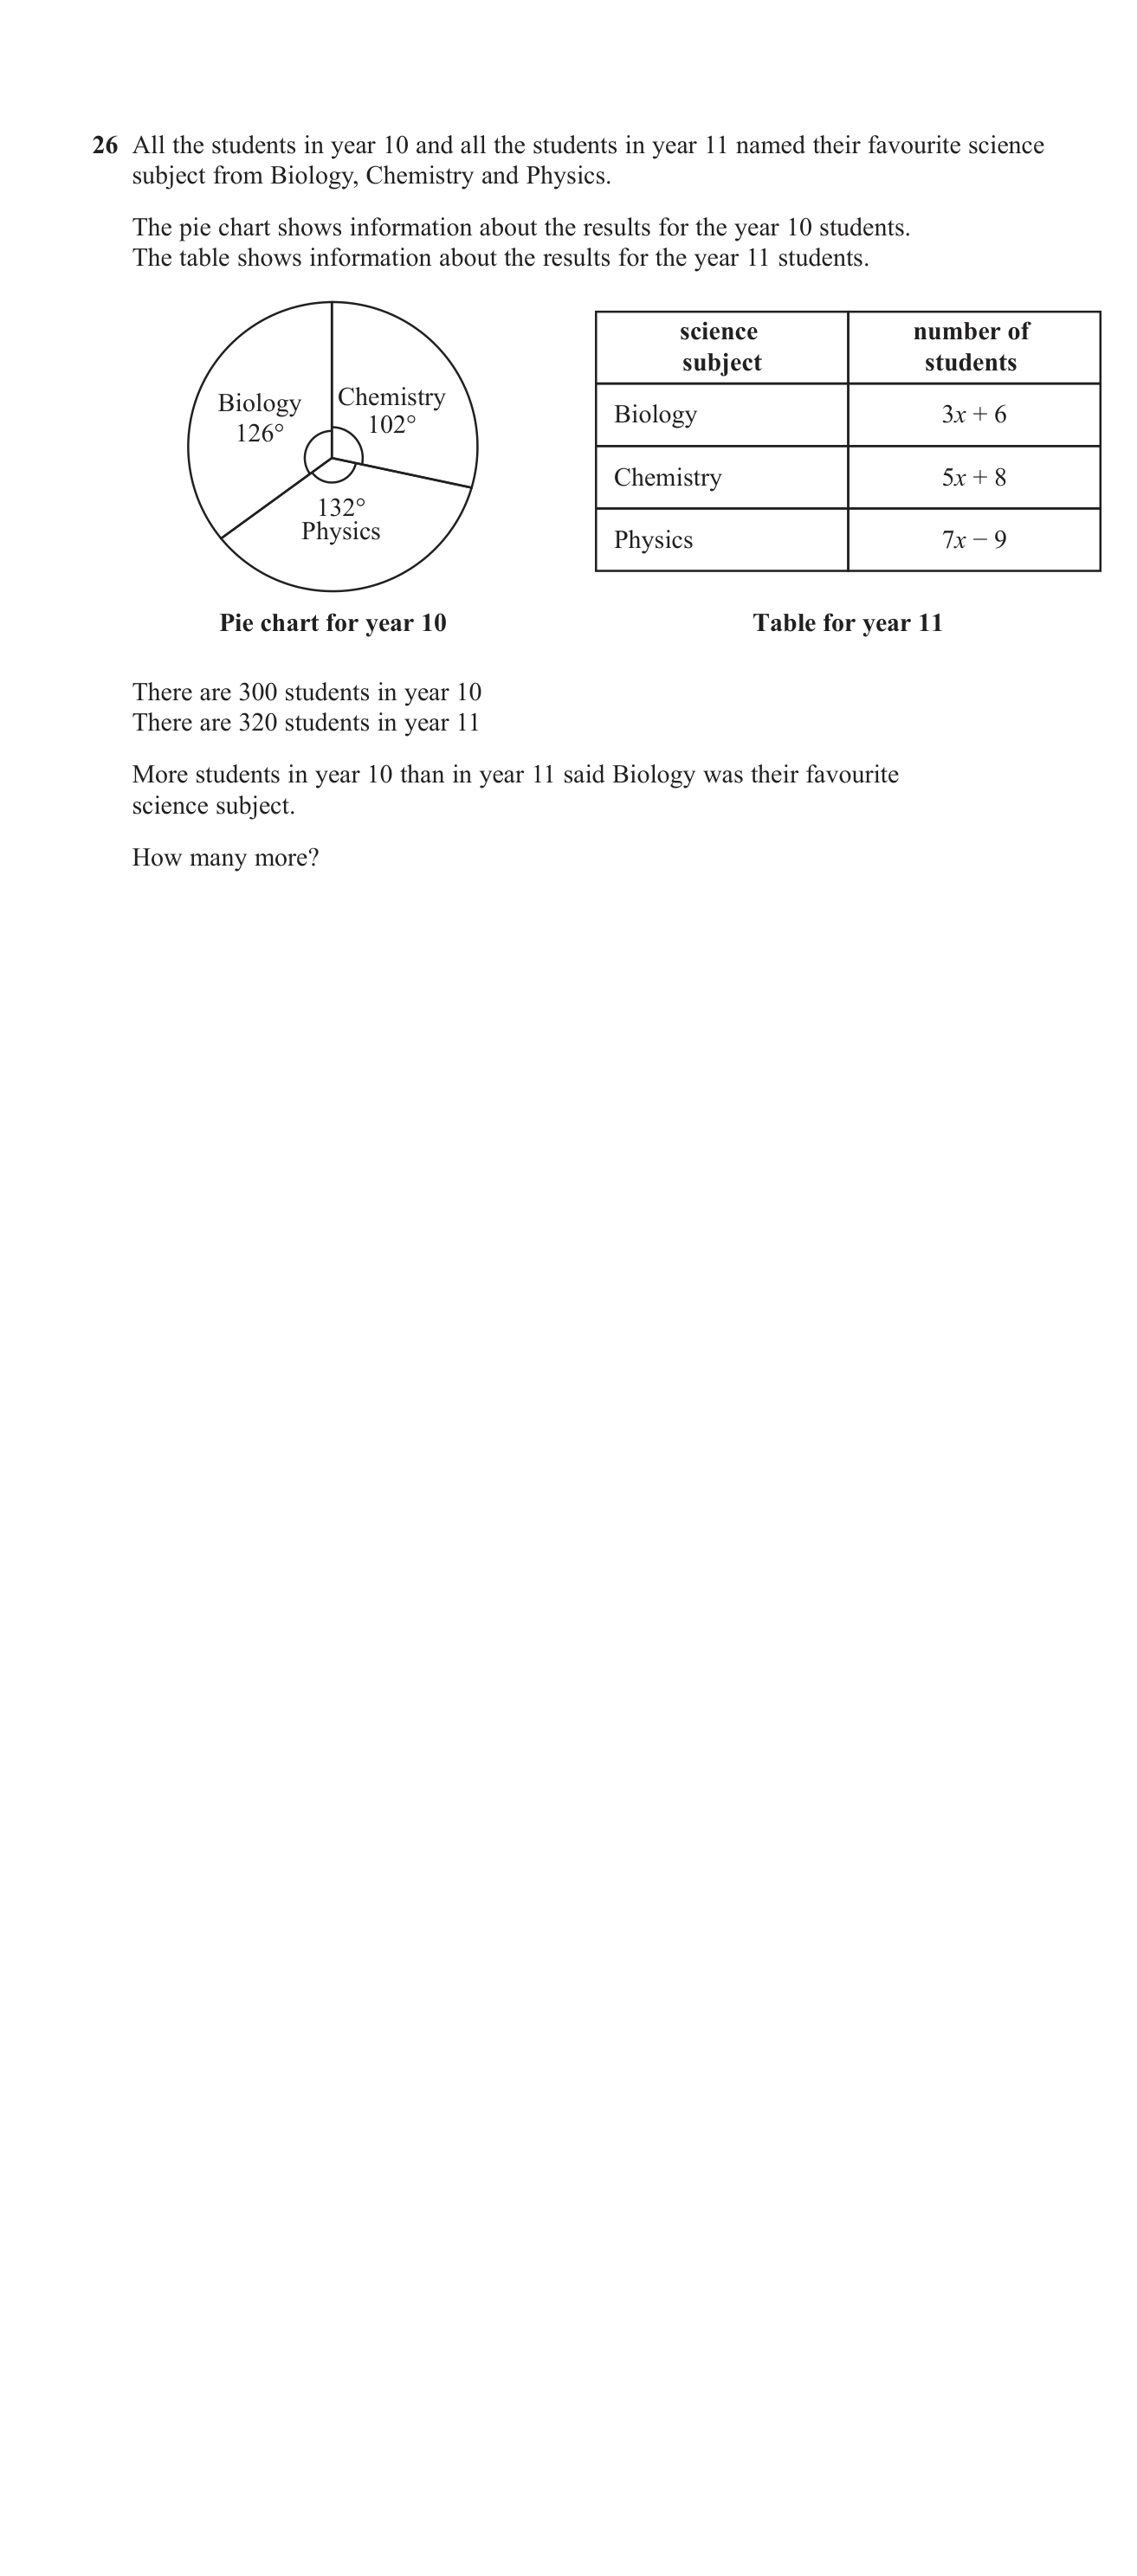
Show mark scheme

Question 15 of 19
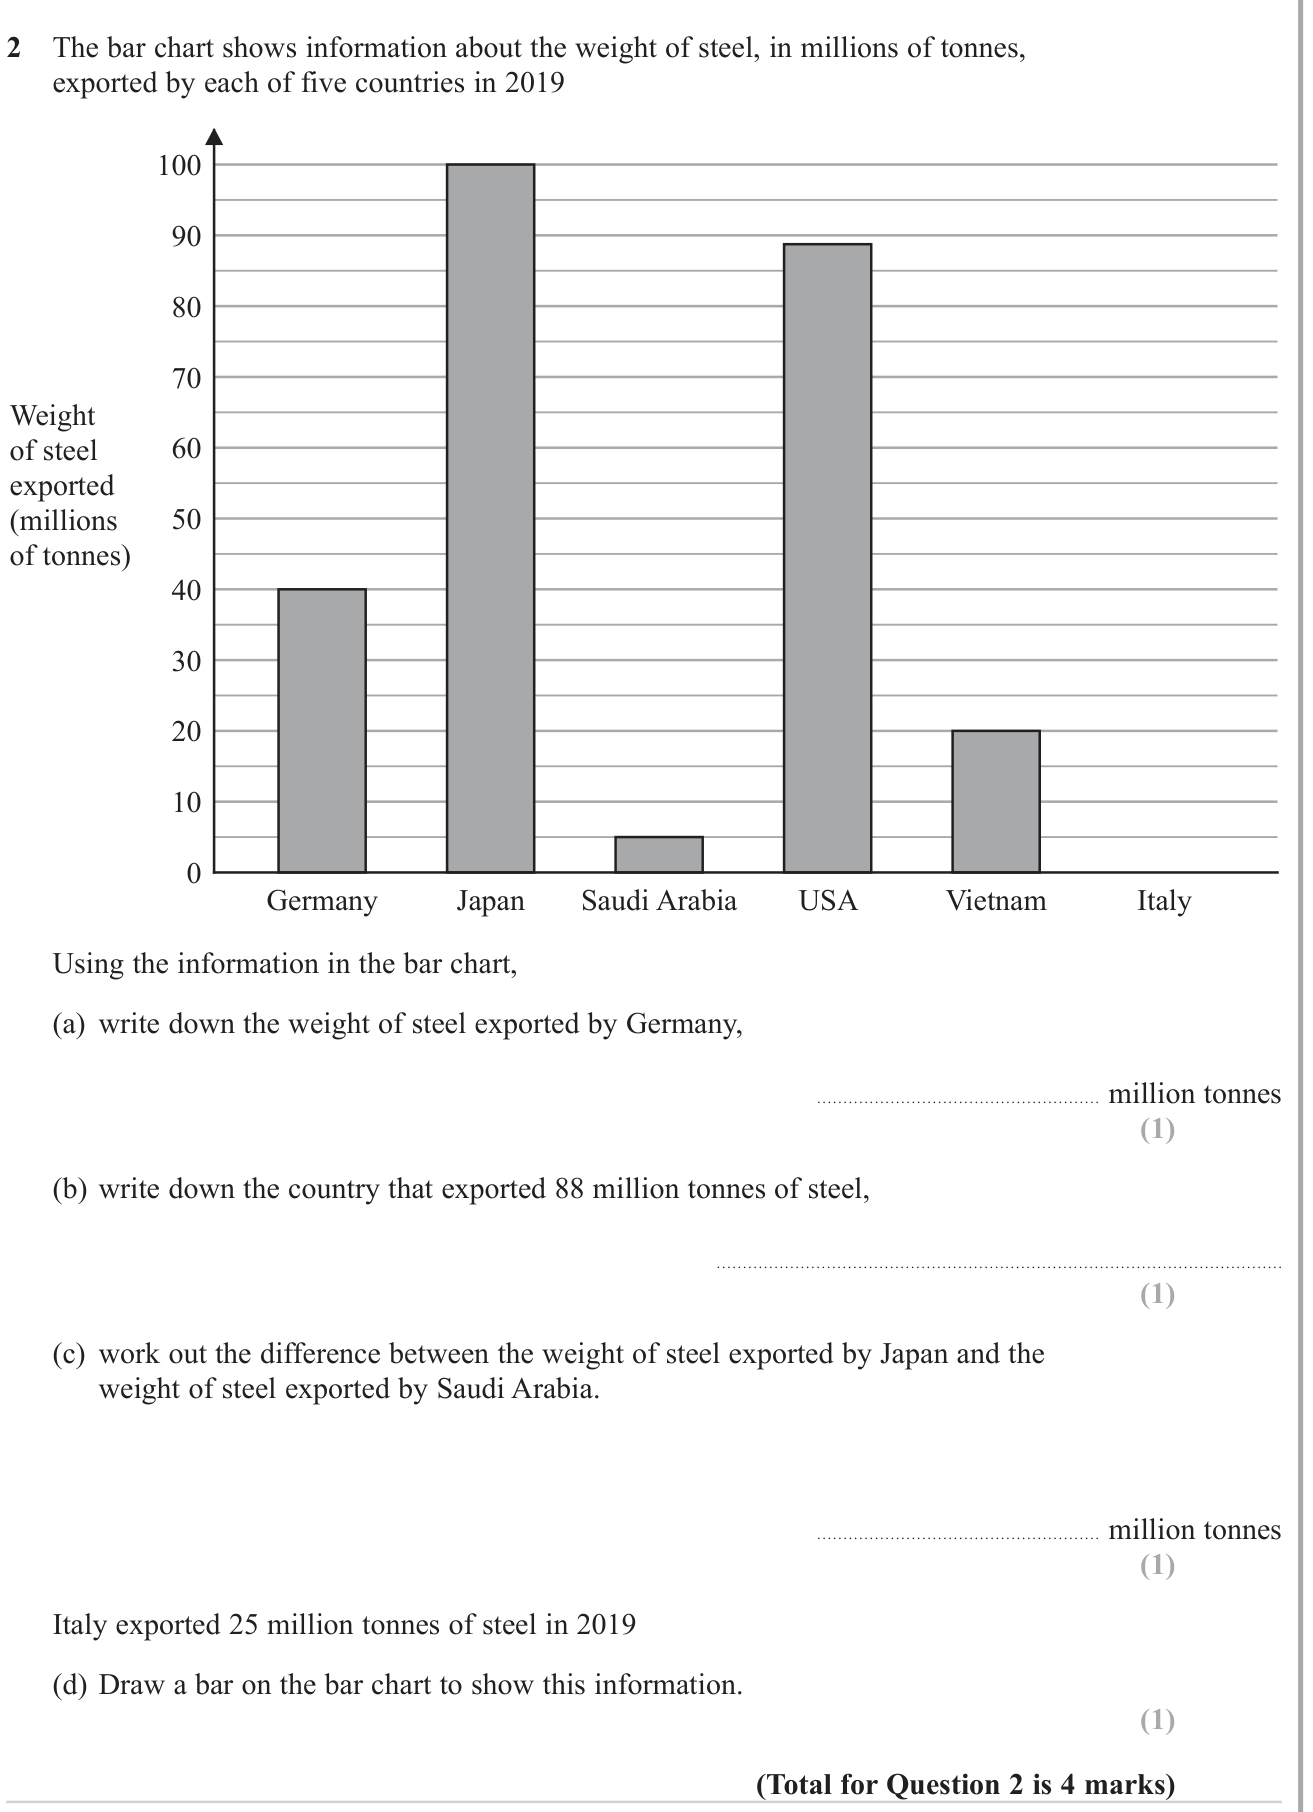
Show mark scheme

Question 16 of 19
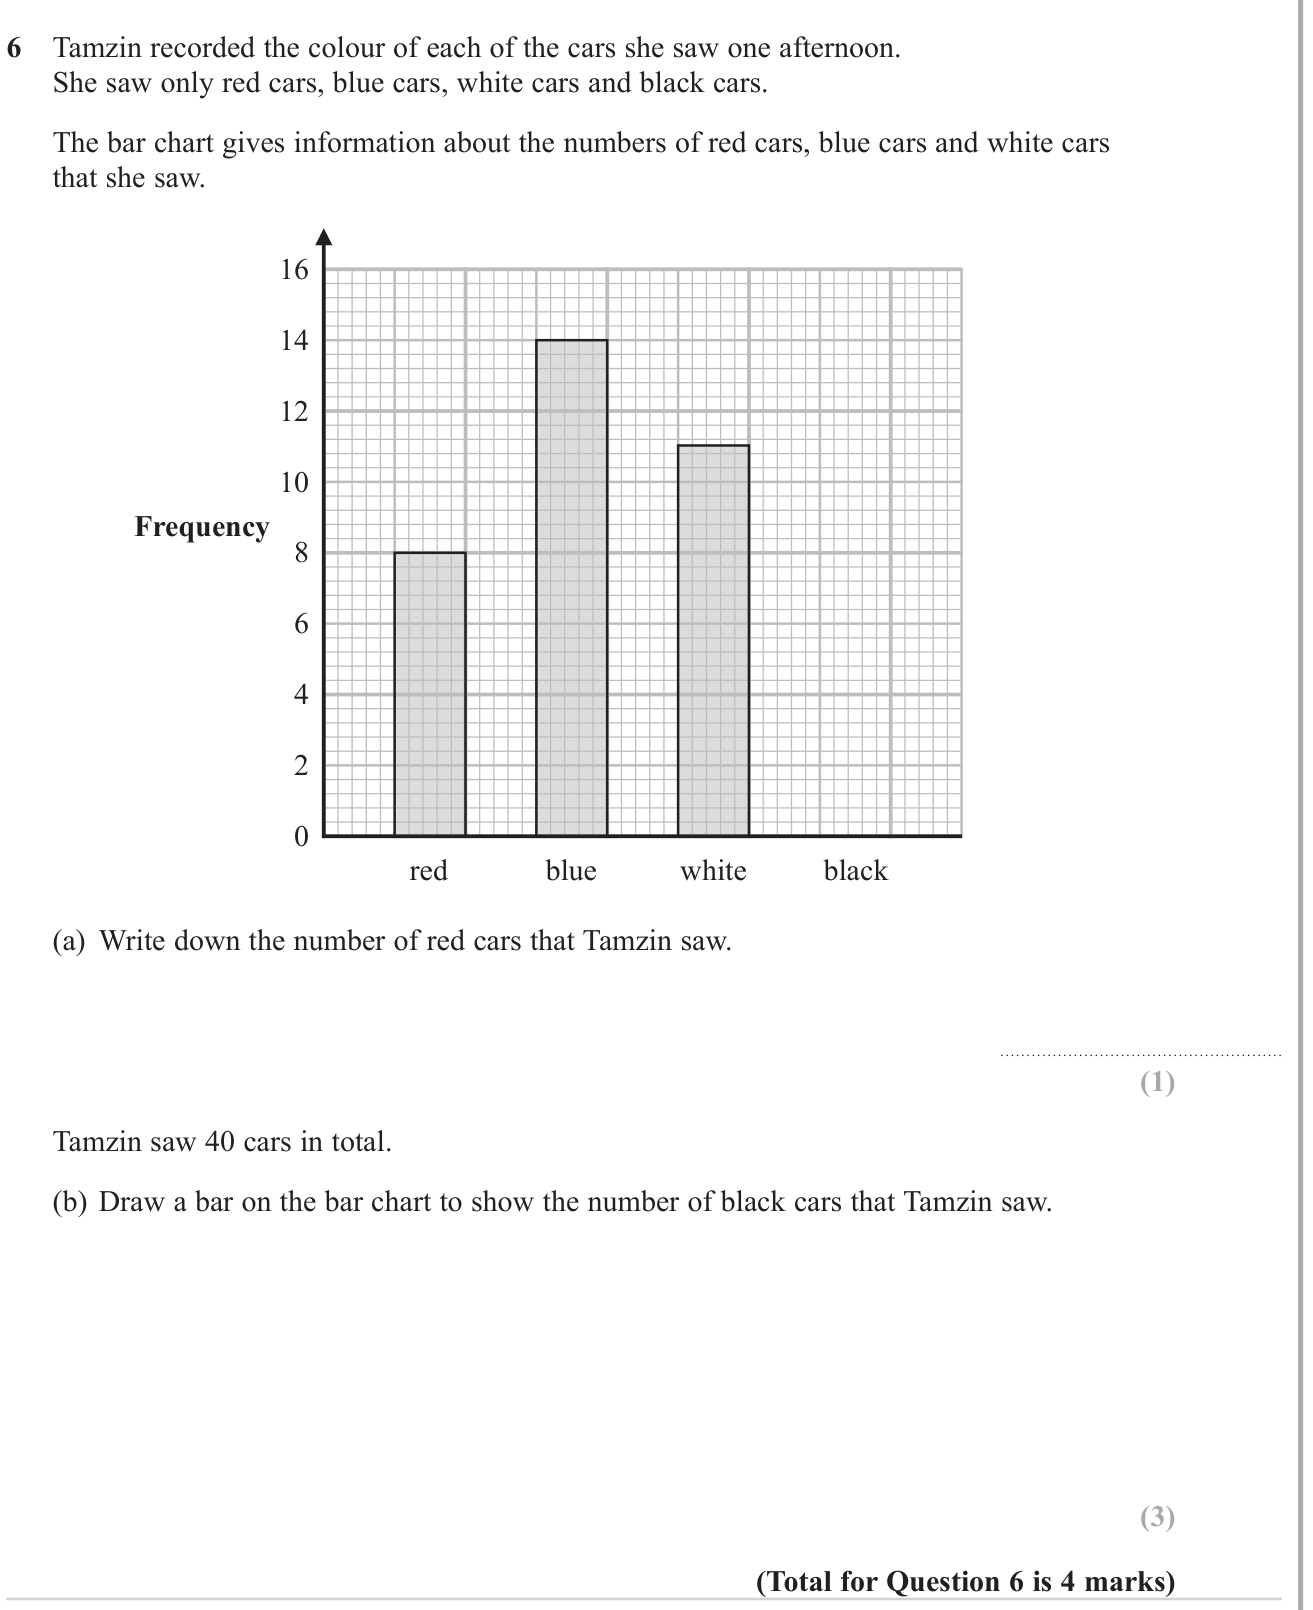
Show mark scheme

Question 17 of 19
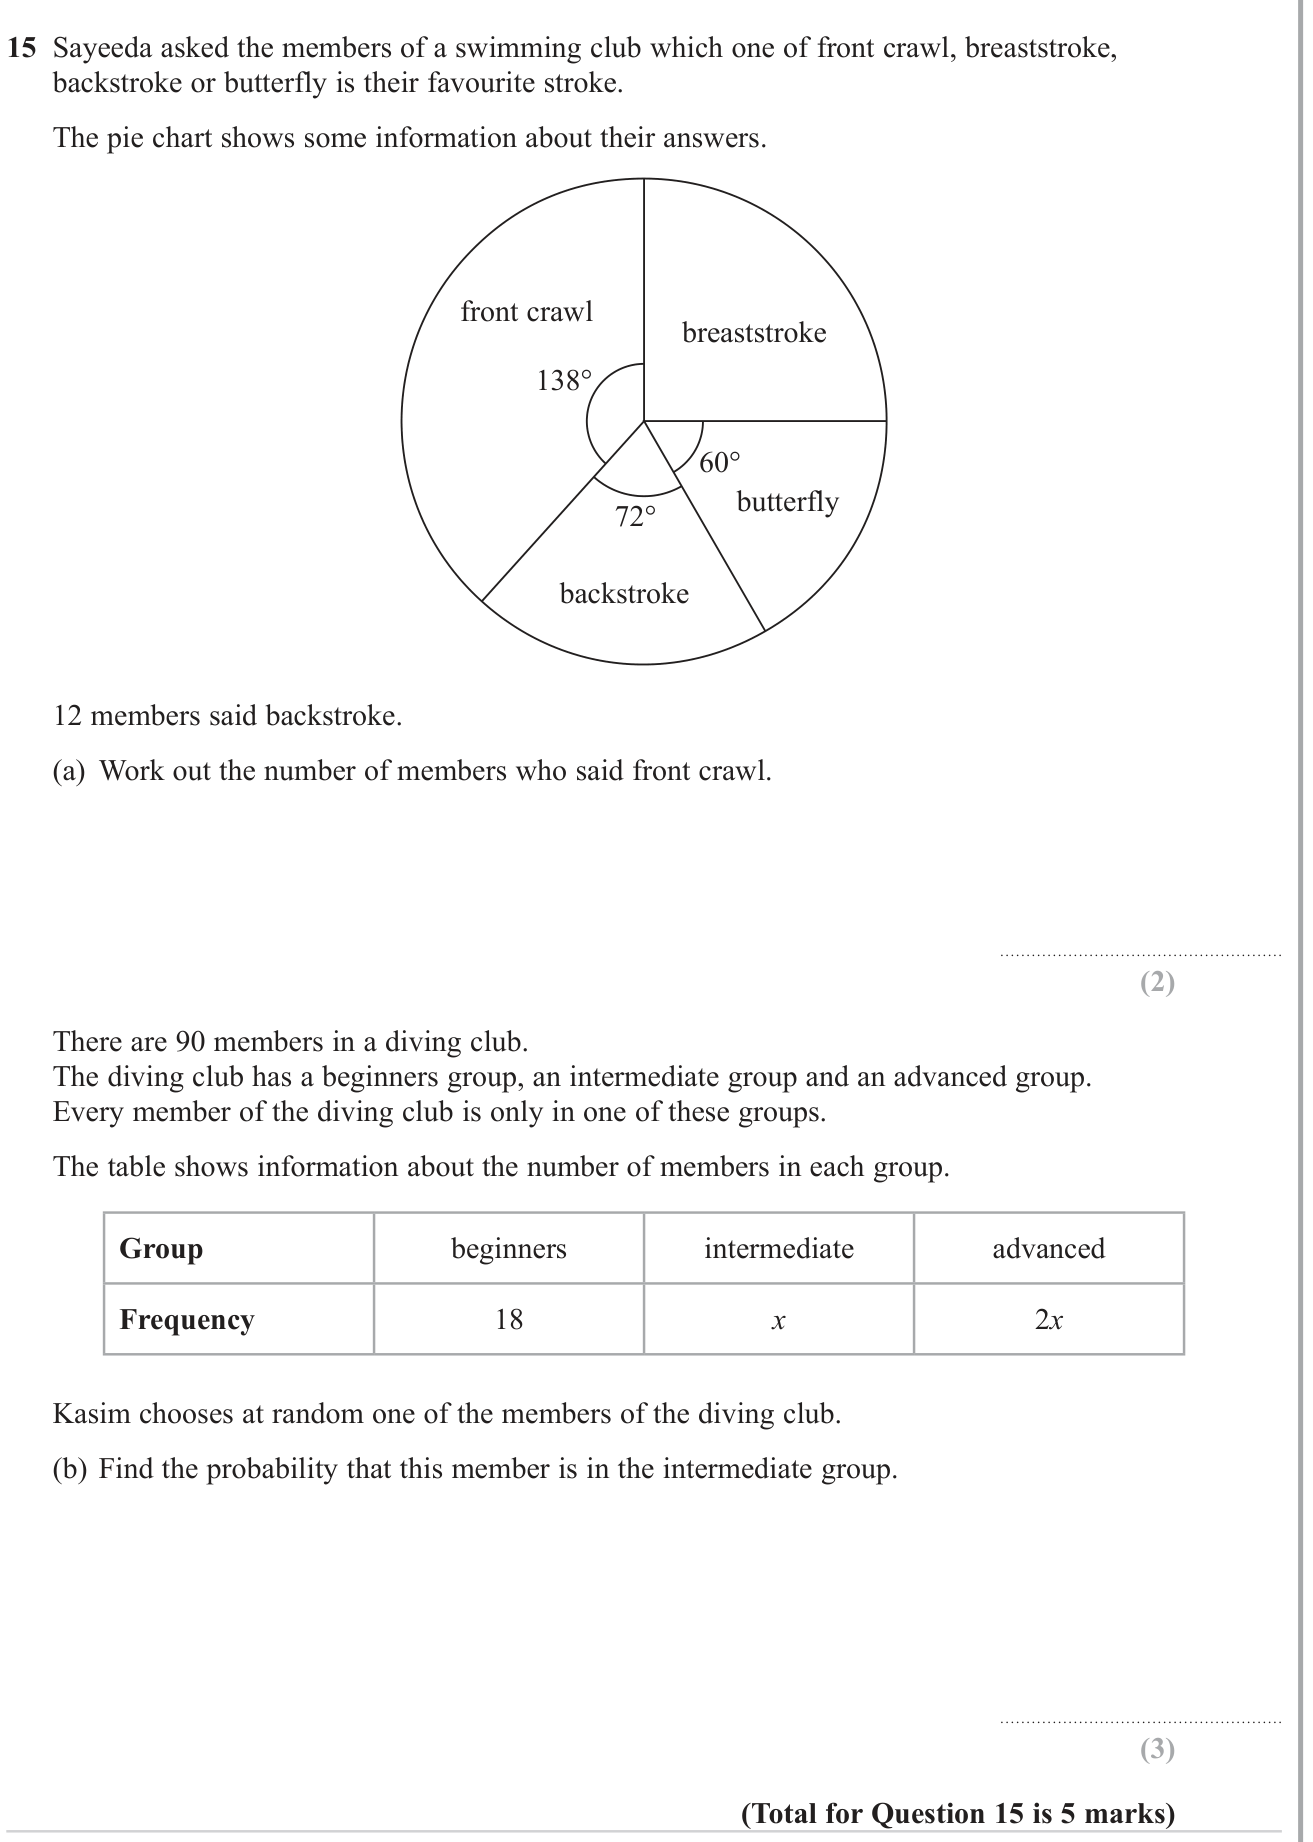
Show mark scheme

Question 18 of 19
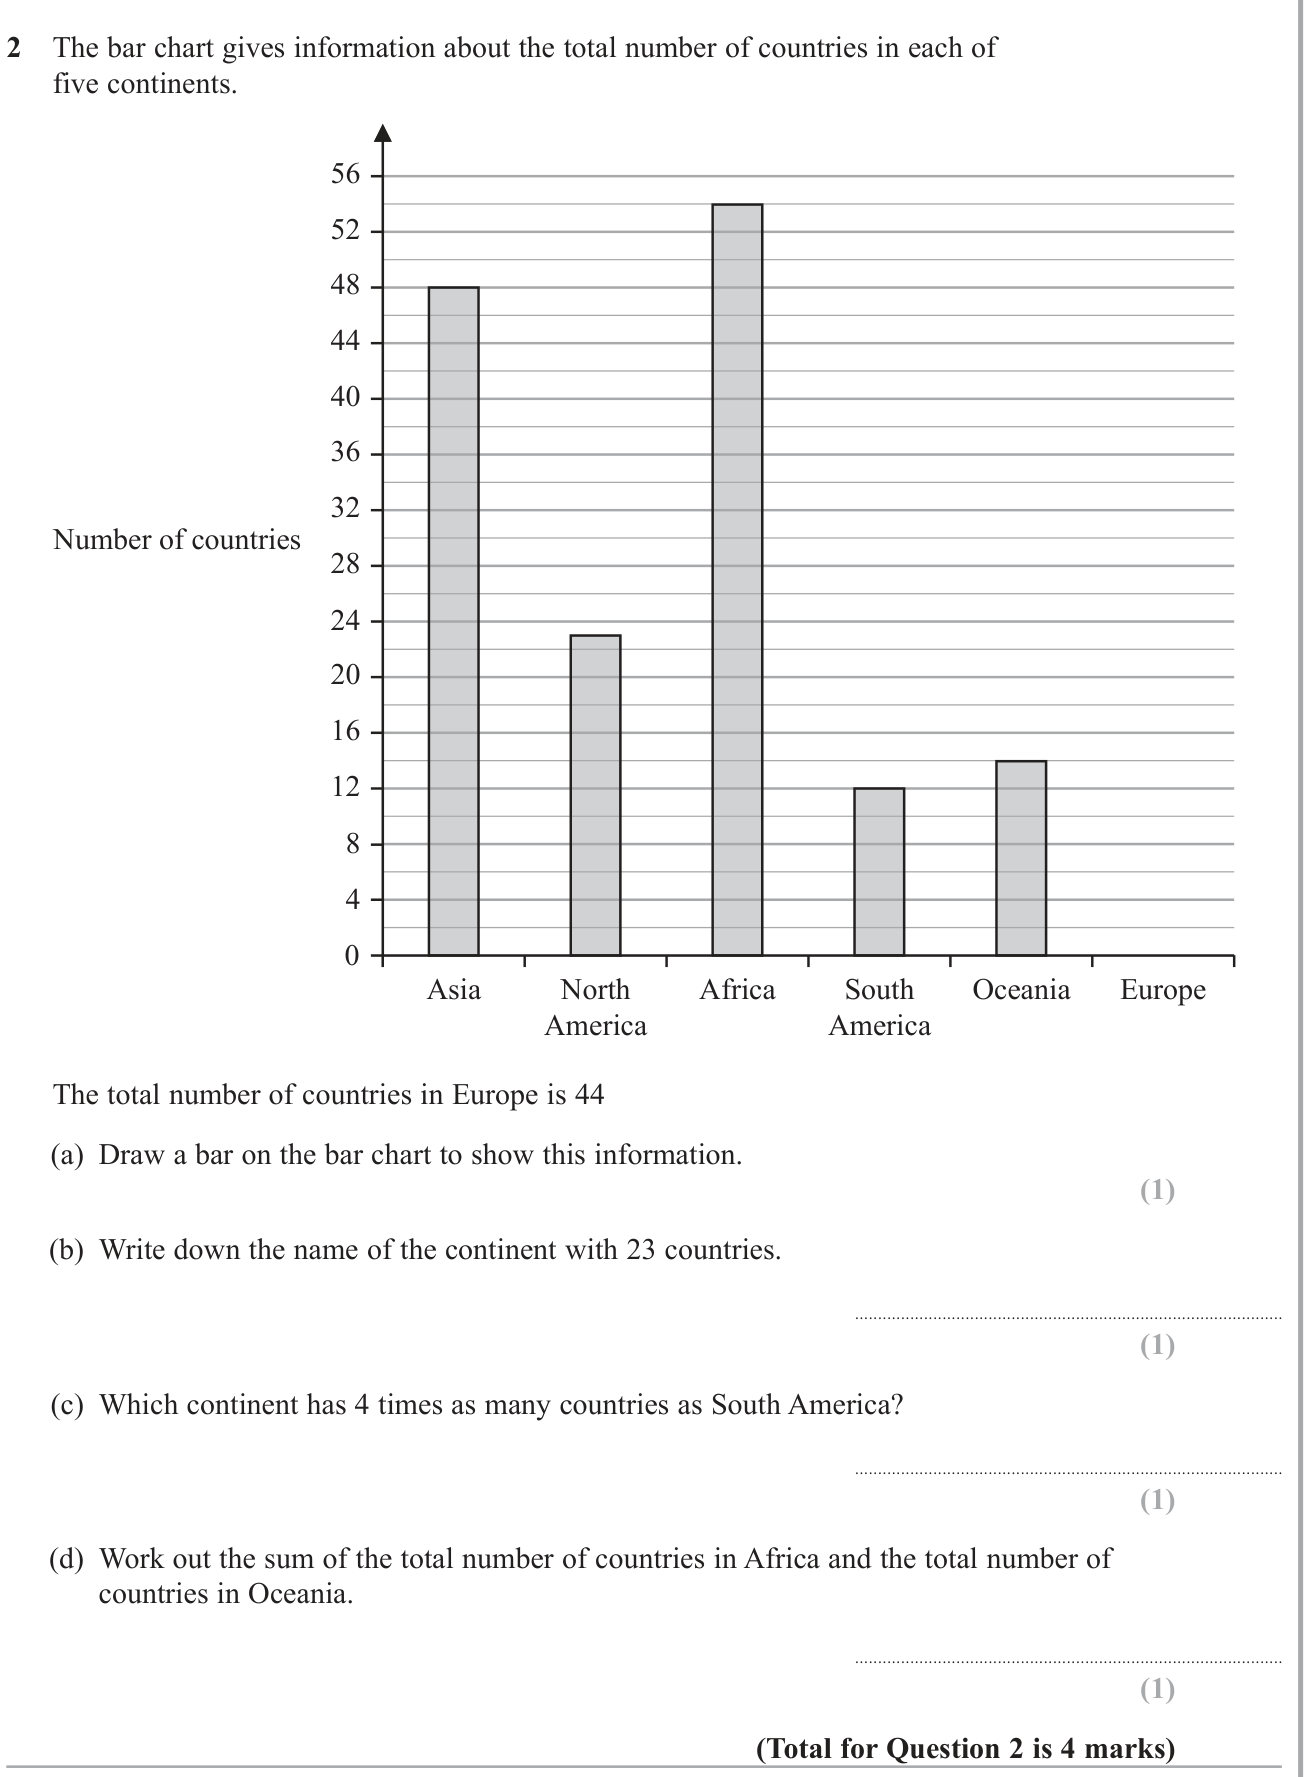
Show mark scheme

Question 19 of 19
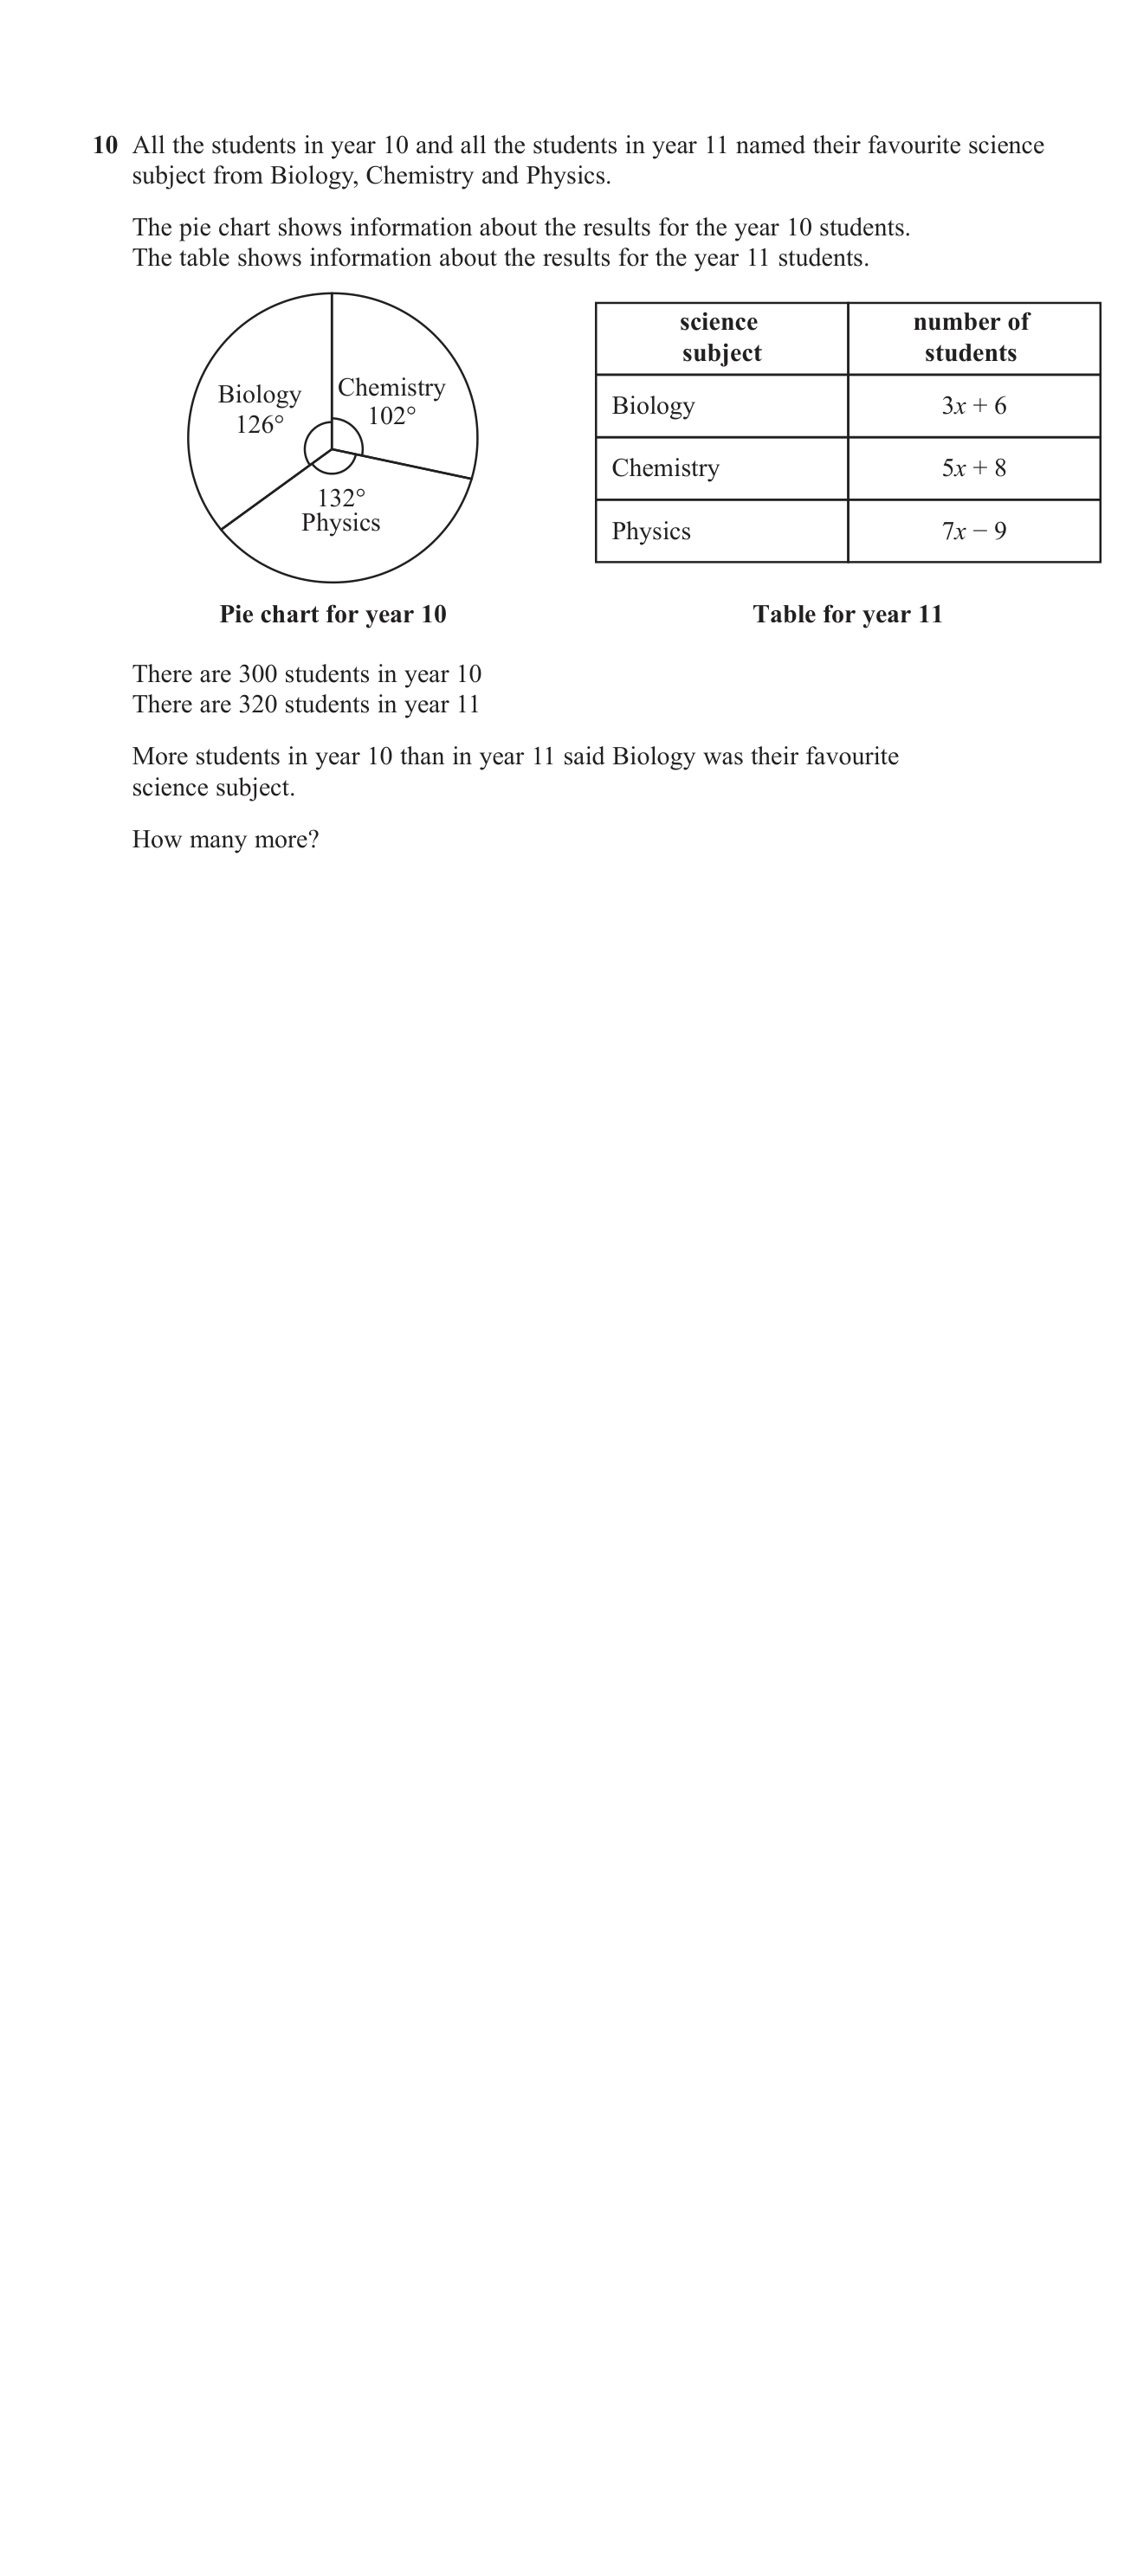
Show mark scheme
